8. Inside an RCS Investigation
RCS makes the most sense when followed as a piece of work rather than a list of components. An administrator creates users and groups. An analyst opens an operation and its targets. A technician prepares a factory configuration. A synchronizing instance becomes an agent record. Evidence appears in typed views, acquires notes and relevance, feeds entities and dashboards, and can trigger personal alerts. Other sections expose the health and infrastructure that keep that workflow moving.
I use the lab’s fictional Operation Nightjar to walk through that loop. Every name, account, location, message, file, device, relationship, and alert described here is synthetic. Most evidence rows went directly into the lab database to exercise the server and Console contract. A separate narrow test used a synthetic encrypted blob to validate Worker and alert processing. No implant, exploit, collector, anonymizer, or Network Injector generated the scenario.
The reconstructed web console is also not the original AIR binary. When the chapter describes a visible interaction, it means one of three things:
- MANUAL — the original RCS 9 manuals document the operator workflow;
- WEB PORT — the reconstructed console implements and tests the relevant MXML/ActionScript contract; or
- LAB — the action reached the original backend through a live test.
Those categories often support the same step, but they are not interchangeable. A screenshot can show that a view renders. Evidence provenance requires a separate record.
The fictional case
The demo seed creates two operations so search and cross-operation views have meaningful choices. This walkthrough stays inside Operation Nightjar, described as a fictional financial-fraud investigation in Milan. The operation contains two targets, each with a desktop factory and a synthetic deployed agent. A shared demonstration group contains two analyst accounts and the lab administrator.
The principal path is:
demo_team
└── Operation Nightjar
    ├── A. Moretti (laptop)
    │   ├── desktop factory
    │   └── synthetic deployed agent
    └── R. Bianchi (associate)
        ├── desktop factory
        └── synthetic deployed agent
The seed also creates fictional entities—people, handles, a virtual laptop identity, relationships, and positions—and about two weeks of evidence-like records. Recent rows include chats, mail, keylogs, URLs, screenshots, calls, positions, an address-book entry, application activity, a file, clipboard text, and financial-address metadata. The values are invented and exist only to make filtering, viewers, maps, links, alerts, and counters visible.
This scenario is best treated as a UI fixture with investigative coherence. It is not a simulation of how frequently an actual product would collect each type, how reliable that collection would be, or how a real analyst should weigh the resulting material.
Access begins with the work group
An RCS operation is not simply a folder visible to every authenticated user. Its groups determine which users receive access. Targets, factories, and agents sit below the operation, and their denormalized user relationships are rebuilt from that hierarchy. The console loads only objects visible to the logged-in session.
In the Nightjar seed, demo_team contains the two fictional analysts and the
administrator before the operations are created. Adding a user to the group
after the user has already logged in does not necessarily update every piece of
client and session state immediately. The live tests therefore create group
membership first and log in afterward.
The distinction between role and case membership is important. Privileges decide whether a user can see a major section or invoke a category of action. Group-derived access decides which investigation objects populate that section. A user can possess view privileges yet see no Nightjar tiles because the operation is not in the user’s group-derived scope.
That division also explains several security findings in Chapter 10. Group and path maintenance are not mere interface bookkeeping; they are part of the authorization model. Stale, missing, or overly broad relationships can expose or hide an investigation even when the user’s named role appears correct.
The Accounting section presents this setup to administrators as Users and Groups. User forms combine enabled state, locale, timezone, contact details, and a large privilege matrix. Group forms join users and operations. Active sessions can be disconnected, subject to the same session behavior described in Chapter 5. The manual audit confirms the visible user/group workflow, while live tests exercise creation, update, membership, and deletion with disposable accounts.
Entering an operation
The Home screen offers global search, recent items, and quick actions. Searching for “Nightjar” can jump directly into the operation, but the most legible route begins in Operations. The root view shows the operations available to the current user as tiles or a table. Selecting a tile fills an information panel; double-clicking it moves into the operation’s targets.
The original manual describes operation details including name, description, contact, status, and groups. Operation Nightjar uses these fields to give the otherwise abstract container an owner and purpose. A breadcrumb records the path and provides shortcuts back to higher levels.
The port’s Operations Section State Manager represents the drill-down explicitly:
allOperations
  → singleOperation
    → singleTarget
      → singleAgent
      → agentConfigList → config
      → evidence / filesystem / commands / info / IPs / file transfer
This is more than navigation chrome. The state determines which manager view is active, which selected object supplies identifiers to REST calls, which columns are shown, and what the Back action must restore. Opening an evidence view under one agent, for example, hides the agent column because that context is already fixed. Opening evidence from a broader target or operation context requires the column to distinguish sources.
Closing an operation or target is also not a local visual flag. The backend cascades status to descendants. Destruction and moves affect paths, access, statistics, and sometimes deferred cleanup. Tests deliberately destroy child operations before their groups because reversing that order can empty access lists and leave an object the cleanup user can no longer delete.
Targets, factories, and agents are different records
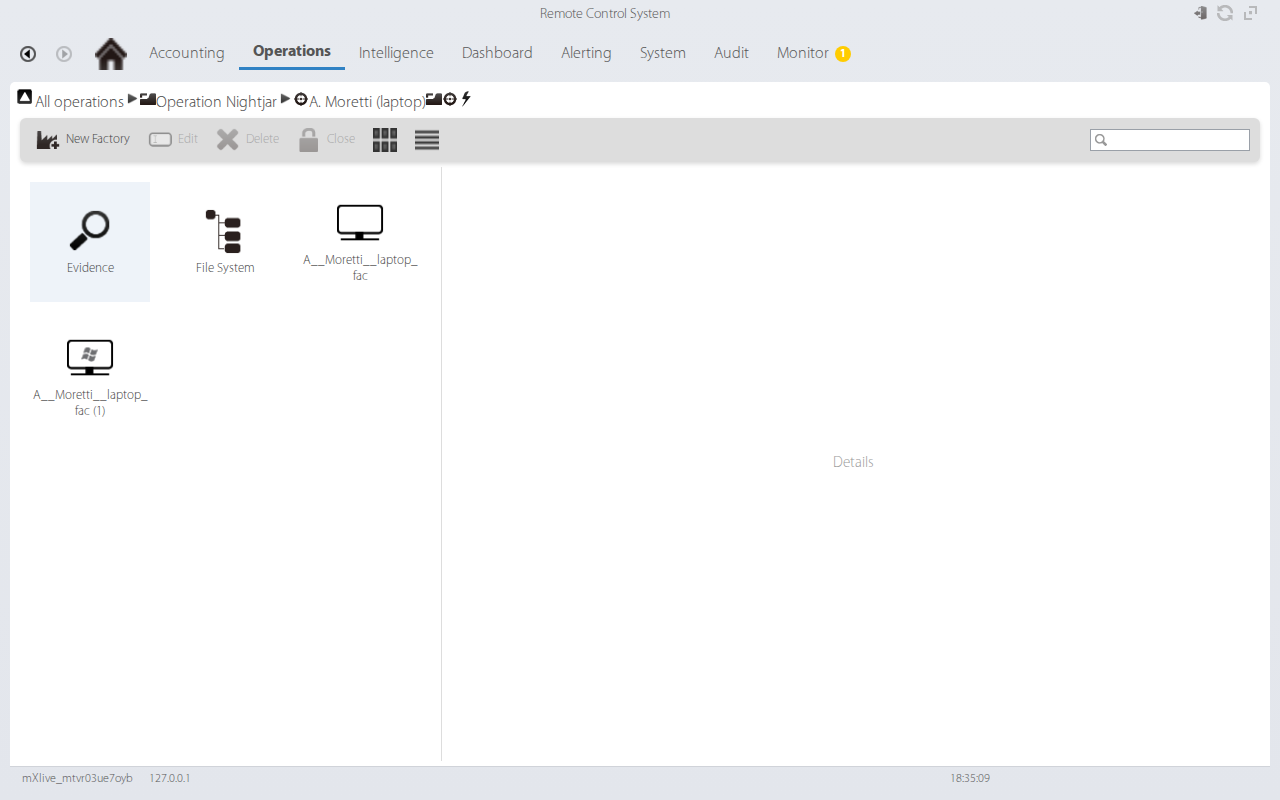
Opening the fictional target A. Moretti (laptop) reveals both a factory and a
deployed agent tile. The icons look related because both represent potential or
actual collection configurations, but their lifecycle differs.
A factory is a template—closer to a blueprint than a running instance. It has a platform family, level, configuration, identifier, and an open place in the operation hierarchy. A deployed agent is the backend record created when an instance identifies itself through the first-synchronization status path. It carries an instance identifier, version and platform fields, runtime status, statistics, request queues, and accumulated configurations.
The demo uses the authentic /agent/status transition to clone each open
factory into a synthetic deployed record. That proves the database’s factory
to agent lifecycle without transferring or executing a payload. The record is
named from the factory with an instance suffix, just as the original backend
does.
This distinction prevents a common reporting error. A factory in a seized RCS database can show intent, preparation, or capacity. A deployed agent record is stronger evidence that the backend recognized an instance. Neither fact alone proves successful collection from a named person’s real device; attribution still requires identity, timeline, network, and host evidence.
The agent’s landing page turns one record into several pseudo-items: Evidence, File System, Commands, Info, IP addresses, File Transfer, and Configuration. These are not child documents of one uniform type. Each opens a different API and data model while preserving the selected agent context.
Configuration expresses a state machine
The factory configuration editor has Basic and Advanced modes. Basic mode presents recognizable collection categories—calls, contacts and calendars, messages, visited websites, files and photographs, keylogs, screenshots, camera, position, and online synchronization. Availability depends on the factory’s desktop/mobile type, platform, level, and demo status.
These rows express what an operator could configure, not proof that the frozen endpoint tree implemented every selection. The static audit in Appendices D–E checks the other half of that claim against platform factories, concrete modules, and evidence writers. It finds meaningful differences: iOS marks several categories as remote agents, BlackBerry’s camera is build-conditional, Scout is deliberately narrow, and the Windows desktop print registrar is disabled. A configuration-visible label is therefore evidence of product intent; only a matching source chain supports an implementation claim, and neither proves deployment or successful collection.
Toggling one row does not merely set enabled: true. The original
BasicConfigBuilder constructs a graph of events, actions, subactions, and
modules. It adds startup and repeating triggers, module start and stop work,
and synchronization behavior. File rules and timing options become fields in
that graph. The web port follows the builder logic so the backend receives the
shape the AIR console would have produced.
Synchronization configuration also joins the factory to infrastructure. The
first synchronize subaction names a collector entry point. Unless a separate
hostname feature is licensed, the selected collector must match the agent’s
good routing flag. A configuration can therefore be syntactically valid yet
rejected because its collection path is inconsistent with the target record.
Advanced mode makes the generated graph visible in three columns:
events                 actions                   modules
startup ─────────────► start keylog ───────────► keylog
timer   ─────────────► take screenshot ────────► screenshot
timer   ─────────────► synchronize ────────────► transport settings
The actual demo graph contains more nodes and connections; this diagram only illustrates the model. Events provide start, repeat, and end pins. Actions can enable or disable events and start or stop modules. Module forms expose type-specific parameters. Editing or deleting a node has to repair invalid connections rather than leave dangling identifiers.
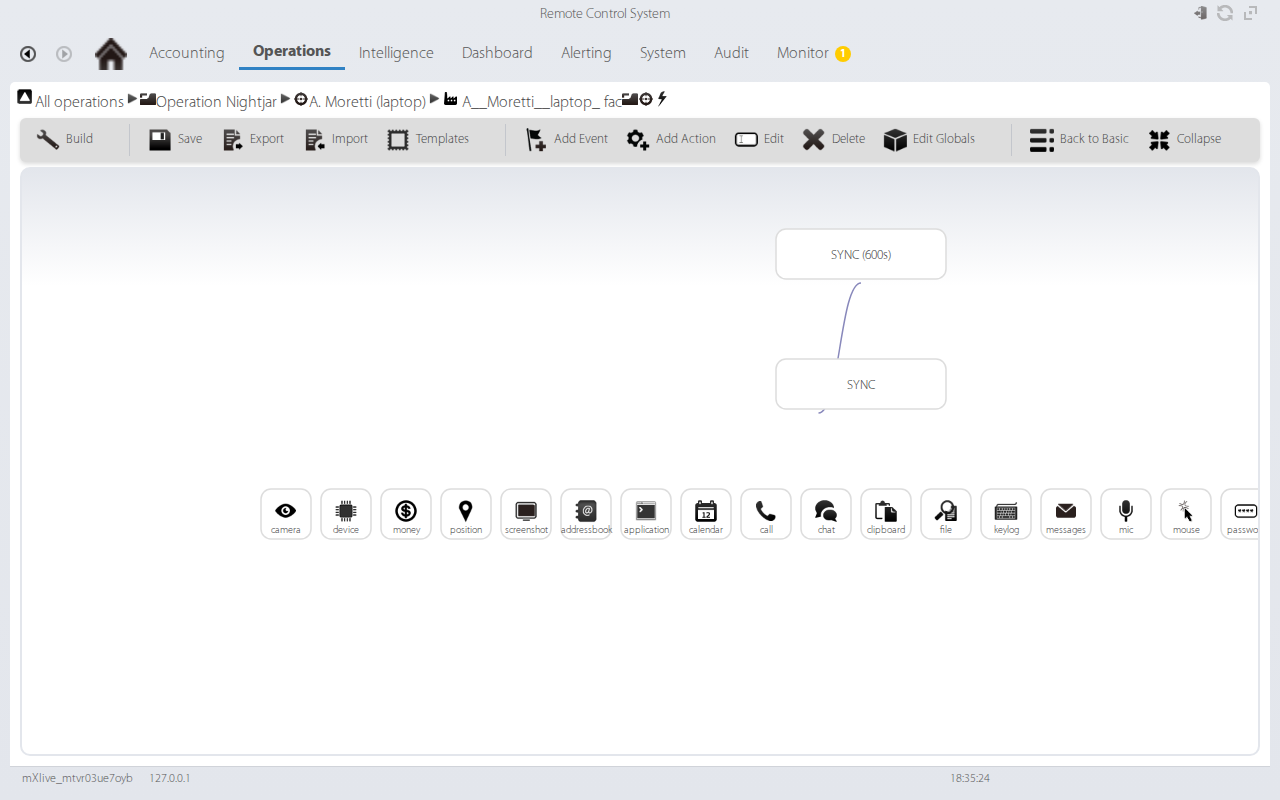
Converting a basic configuration to advanced is a persistent action. The manual-audit test restores the seeded factory afterward so subsequent runs remain repeatable. Templates can save and reload configurations filtered by agent type and editor mode. Import and export operate on the configuration document.
The original console placed build choices near this editor. The web port shows their descriptive tree so the reader can understand the product workflow, but Create is render-only and never posts a build task. Configuration of a synthetic backend record is inside the lab boundary; creating an operational installer is not.
Synchronization turns preparation into activity
When an instance synchronizes, the backend updates the deployed agent’s version, source address, device and user strings, time, and status. It also propagates recent activity into target and operation statistics and can create a synchronization alert. In the console, an idle tile can become active and dashboard counters can change through push events.
The web demo does not keep a target device connected. Its deployed agent is a database record created through the status handshake, and its last-sync values are synthetic. That is sufficient to test how activity appears to an operator, but not command delivery or endpoint collection.
The IP-address pseudo-view exposes a version boundary. The 9.6 console library
calls /evidence/sync_history, while the examined 9.2.3 server lacks that
action. The request falls through and returns 404, so the live grid remains
empty. The port does not invent a successful response to make the walkthrough
look complete. A missing panel can be fidelity evidence.
The evidence grid is the analyst’s workbench
Opening Evidence under the synthetic Moretti agent produces the nine-column grid described in Chapters 6 and 7. By default it asks for the last 24 hours. Acquired and Received are separate clocks: one describes when the evidence claims to have been captured, the other when the backend processed it. An analyst can switch the basis and widen the period to a week, month, or all records.
The fictional recent rows were designed to create a plausible analytic thread: a chat mentions a shipment, a mail mentions delivery, a keylog contains a wallet or banking term, a URL shows a financial portal, a position falls near Milan, and a file path names an invoice. These facts are not real and do not collectively demonstrate wrongdoing. They simply let the interface show how heterogeneous records can be reviewed together.
Six kinds of filter shape the work:
- acquired/received date and relative time range;
- one or more evidence types;
- five relevance levels from untagged to critical;
- report or “blotter” membership;
- text across identifiers, summary information, and notes; and
- agent selection when the view spans multiple agents.
Filters can be saved as named presets. Type summary chips display counts and can narrow the grid. Because four pseudo-view types are excluded from normal evidence statistics, raw database totals can disagree with visible summary counts without either being wrong.
Opening a row selects a viewer appropriate to its type. Chats become a conversation; messages fetch body and attachment detail; calls and microphone records expose audio controls; screenshots and camera records load GridFS images with zoom and rotation; positions open a map; keylogs and clipboard records use text views. Previous, next, and Escape let an analyst move through the current filtered result without returning to the grid each time.
The analyst can assign relevance, add a note, place a record in the report, export it, or delete it if privileges permit. These are mutations, not harmless display preferences. Relevance can affect alerts and triage; notes become shared investigative content; report flags select material for later use; deletion can remove metadata and linked GridFS content. The Audit section records many actions, but Chapter 7 explains why the audit trail is neither complete nor cryptographically tamper-evident.
Requests are promises, not results
File System, Commands, and File Transfer can look like direct remote-control panels. Their backend representation is more cautious: they combine stored evidence with queues of requests that may or may not be delivered later.
The filesystem begins as a lazy tree. Expanding a synthetic root asks for rows at that path. A red pending marker means a retrieval request exists; a green row means a filesystem result was received and stored. “Retrieve subtree” adds a request with a chosen depth. “Retrieve default” asks for a predefined set. Downloading a file creates another request, while exporting a filesystem structure creates a backend task over already stored data.
Commands has two related views. Stored command evidence shows output already received by the platform. The queued-command popup lists instructions waiting for an agent and permits creation or cancellation according to privileges. File Transfer similarly separates upload and download requests. An upload first places a temporary file on the backend, then creates an agent request; an optional execute choice adds a command request referencing the future agent path.
In this project those controls are exercised only against synthetic records and mock/live backend contracts. No implant polls the queues, no real device executes a command, and no target filesystem is browsed. A row saying “queued” establishes intent at the server. Delivery and execution remain outside the test.
That distinction is essential in incident response. An instruction in an RCS database may show operator intent. A returned evidence record, synchronized status, endpoint artifact, or network trace is needed to establish what happened beyond the server.
Intelligence turns records into assertions
The Intelligence section sits above raw evidence. It organizes entities by operation and provides list, table, geographic, and link-graph views. An entity can represent a person, target, or virtual identity; handles attach mail addresses, phone numbers, usernames, and similar identifiers. Links carry a type, direction, and relevance.
Operation Nightjar contains fictional people named Marco Riva and Elena Conti,
a virtual Riva laptop identity, mail and phone handles, and links such as
“known by” and “uses identity.” Positions around Milan make the map view
visible. These relationships are seed assertions, not correlations inferred by
the lab from the fictional evidence.
The Entity Sheet combines description, photograph, handles, profiling tabs, and last-known position. Some profiling endpoints derive frequent contacts or other summaries from stored evidence. The graph draws entities and their links; double-clicking a node opens the profile. The geographic view shows positioned entities and falls back cleanly if map tiles are unavailable.
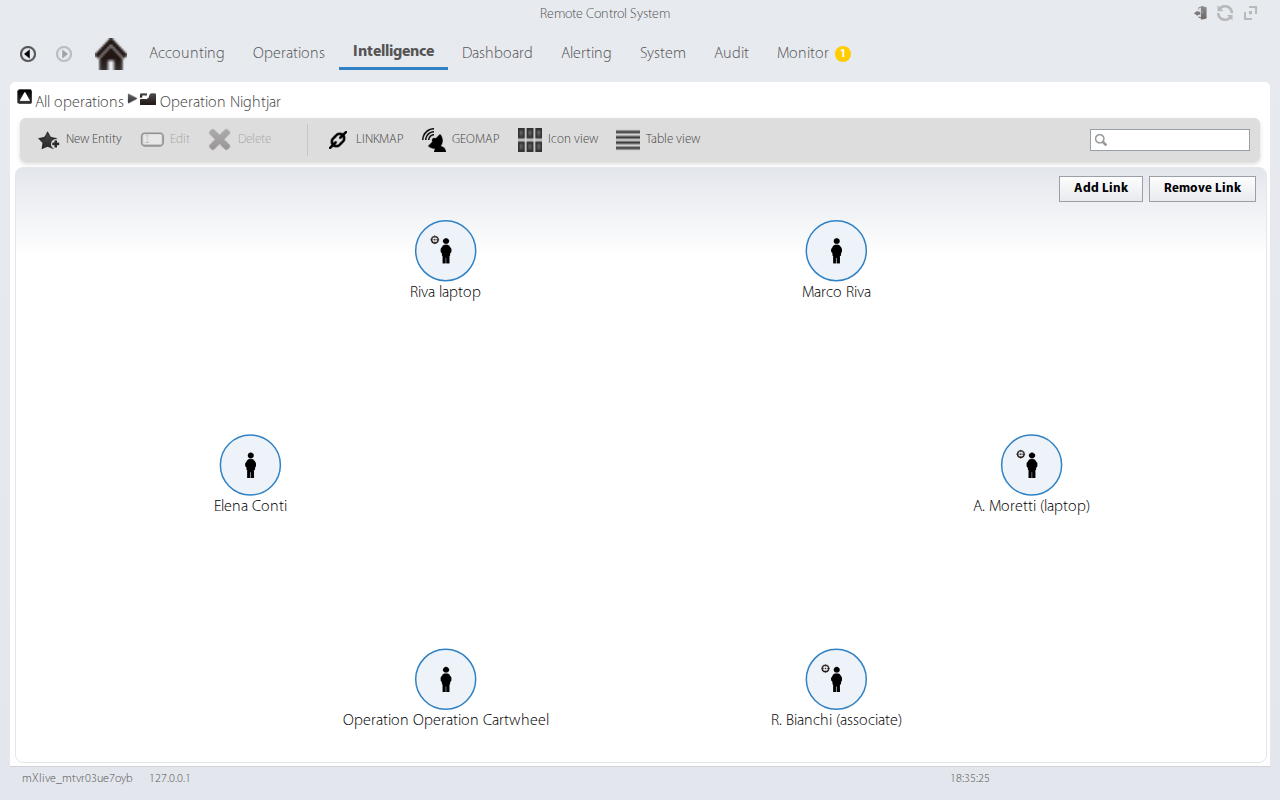
An analyst should treat this layer differently from the evidence grid. An evidence record has a provenance path, however imperfect, through an agent and target collection. An entity link may be a human interpretation, a manual entry, or a derived association. The interface’s clean graph can make an analytic hypothesis look more certain than its supporting records. Notes, audit events, and source evidence remain necessary.
A worked analytic pass through Nightjar
Consider a fictional shift beginning with a dashboard counter on Operation Nightjar. The counter does not identify the cause, so the analyst drills into the Moretti target and opens Evidence. The default 24-hour view contains a keylog mentioning a wallet term, a recent chat about a shipment, a URL for a financial site, a clipboard reference, and a position record.
The first useful action is not to connect them. It is to check time and provenance. The analyst compares Acquired with Received, confirms that the rows belong to the expected synthetic agent, and widens the filter to a week. An old message and earlier location now provide context. A large delay between the two timestamps would be recorded rather than silently sorted away; it could reflect offline collection, queueing, import, a clock problem, or fixture construction.
The analyst next filters to keylog, chat, message, URL, position, file, and clipboard rather than searching every evidence type for one substring. Type renderers expose different fields, and a text hit in one summary may not mean the same thing as a hit in another. The wallet term in a keylog is fictional captured text. A matching alert log is a derived record. A wallet address in a manually seeded entity would be an analyst assertion. They must not be counted as three independent observations.
Suppose the keylog and message appear relevant to the fictional case. The analyst gives them relevance tags and writes notes explaining the decision, then adds selected rows to the report. A useful note names the supporting record and uncertainty—“wallet string appears in synthetic keylog; ownership not established”—rather than turning a clue into attribution. The report flag means “selected for reporting,” not “verified true.”
The position viewer shows coordinates near Milan. The analyst can compare them with the Entity map, but geographic proximity alone does not identify the device user. Accuracy, acquisition time, source type, and the possibility of stale or synthetic data remain material. In this demo, the entity positions were explicitly seeded and are not derived from those evidence rows; their visual overlap is intentional illustration, not corroboration.
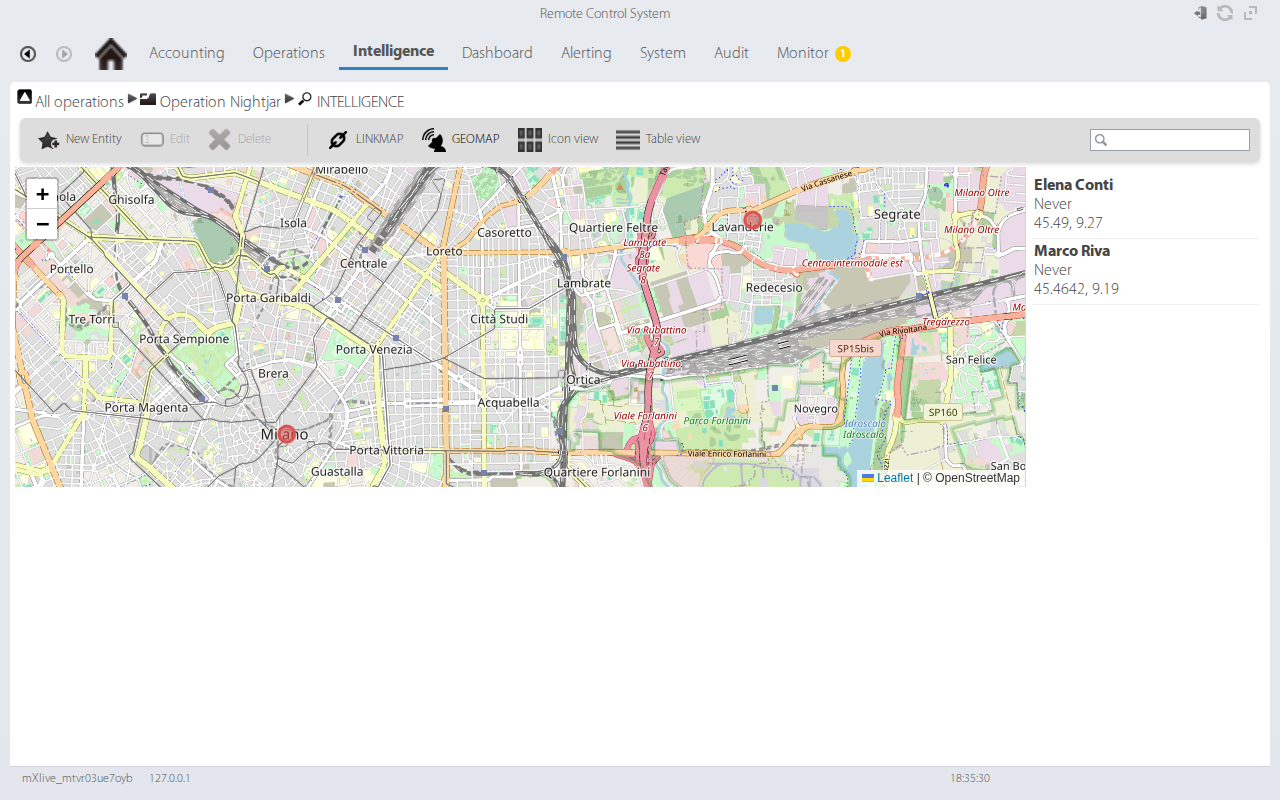
Next the analyst opens Intelligence. Existing fictional links connect Marco Riva, Elena Conti, and a laptop identity. The analyst may add a handle or link, but should cite the evidence that motivated it in the case notes. A “uses identity” edge records an interpretation. If later evidence contradicts it, the graph should change without erasing the original record or reasoning.
Finally, the analyst adjusts a personal alert for future lower-case keylog
records containing the same term and confirms Nightjar remains pinned on the
dashboard. These actions prepare continued review; they do not retroactively
validate the old hit. Alert suppression may combine several future matches in
one log, and dashboard counts may reset around synchronization.
The sequence produces several new database facts: relevance and note changes, report membership, perhaps an entity relationship, a user-owned alert, and dashboard state. Audit may record many of them. The original evidence bytes do not become more authentic because the interface accumulated annotations around them. A defensible export must preserve both layers and their timestamps.
Dashboard compresses the hierarchy
The Dashboard lets a user pin operations and targets from search. Tiles show names, descriptions, last synchronization state, descendants, and evidence activity. Their “new” count is not a fresh count of every record. The client subtracts a stored baseline from the current evidence total and combines it with a dashboard counter that is reset around synchronization.
Nightjar and the second fictional operation are pinned so the reader can compare them at a glance. A push can update counters without reopening the operation. Double-clicking returns to the corresponding hierarchy.
Dashboard identifiers belong to the user. The server updates them but does not
emit a user push in this snapshot, and the session user is a login-time client
snapshot. The console therefore patches its local dashboard_ids immediately
after the save. A pin created outside the page flow may not appear until a new
login.
This behavior illustrates why a dashboard is an interpretation layer. A red counter depends on baseline state, excluded evidence types, synchronization, push delivery, and the user’s current session. It is a cue to investigate, not an authoritative retention count.
Alerts are personal, scoped, and stateful
Alert rules belong to individual users. The Nightjar demo rule watches the
operation path for lower-case keylog evidence containing one of several
fictional financial terms and assigns high relevance. A rule also has enabled
state, event/action category, notification type, and suppression interval.
For evidence alerts, the backend checks four relationships: the evidence type and keyword expression match, the alert path is contained in the agent’s operation/target/agent path, the agent remains visible to the alert owner, and the rule is enabled. A match can change evidence relevance, add work to the alert queue, create or extend an alert log, send a console push, and optionally send mail.
Suppression matters because a burst of records should not necessarily become a burst of notifications. Inside the interval, new evidence identifiers can be added to the most recent log instead of producing another notification. Logs therefore summarize alert activity rather than mirror evidence one-for-one.
The ordinary Nightjar demo evidence was inserted directly through Moped and
never ran Evidence#enqueue. Its illustrative alert logs are fabricated in the
same database shape the dispatcher uses. A separate named live replay now
exercises the real backend path with one synthetic encrypted DEVICE record:
Worker decode, storage, alert evaluation, queue dispatch, embedded log, and
push. Its sanitized trace is preserved in WORKER-VALIDATION.md; it neither
runs the excluded edge components nor makes the Nightjar rows Worker-derived.
Screenshots of the demo alert table prove only rendering of the stored shape.
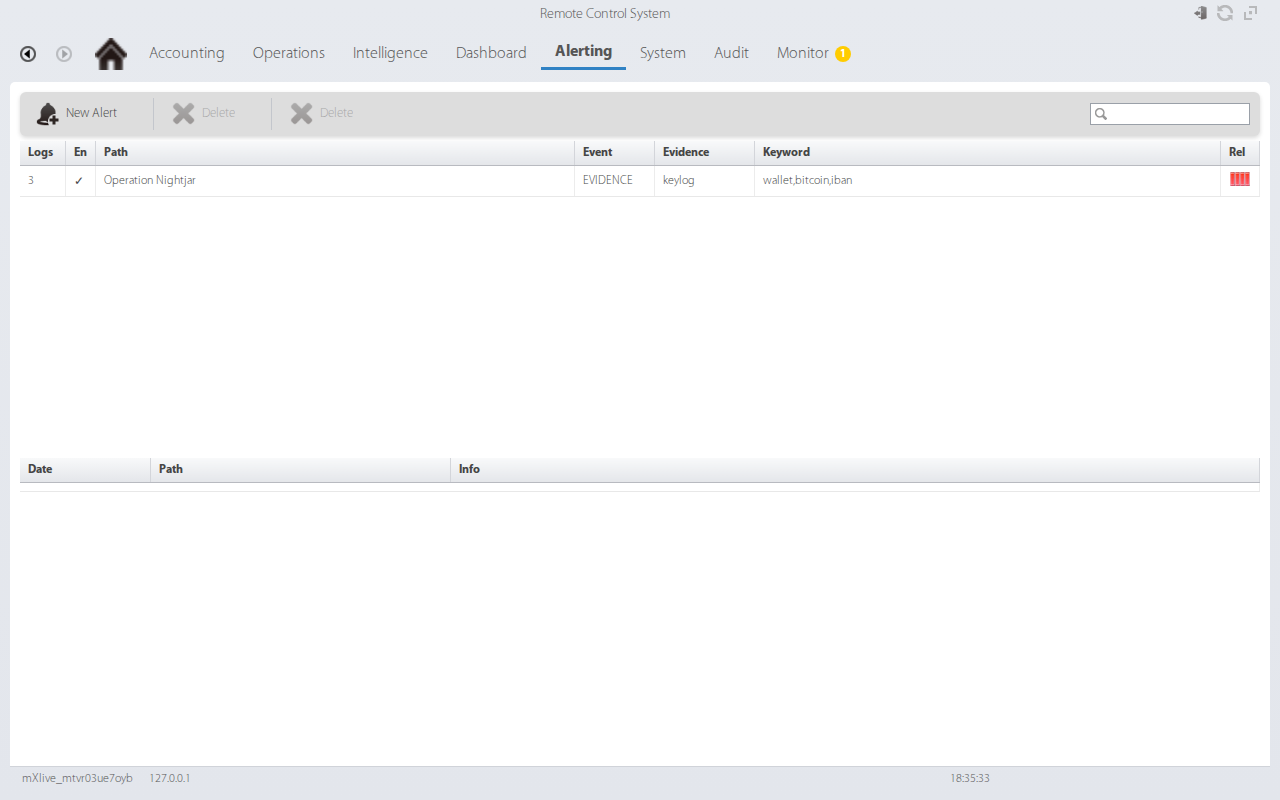
The alert view reloads search metadata before alerts so it can resolve each stored identifier into a readable path. Alerts created through another user’s session are invisible because rules are per-user. Both constraints matter when testing and when interpreting an acquisition.
Audit and Monitor provide different accountability
Audit lists user and system actions with date, actor, action, description, and object-related fields. Column filters can narrow time, actor, action, and text; the visible result can be exported. During a Nightjar walkthrough, it can show logins, object creation, configuration changes, evidence edits, and other application events.
Monitor answers a different question. It lists backend components and their status, CPU, disk, licence capacity, version, and counters. An analyst who sees an empty evidence view might check Monitor for an unhealthy worker or database component; an administrator might see that a licence limit, not a user action, disabled something.
Neither section is ground truth on its own. Audit is stored inside the same database and omits or aggregates some effects. Monitor is a current health view whose heartbeat status can change after the relevant incident. Host logs, MongoDB state, network evidence, backups, and session history remain necessary for a defensible reconstruction.
Collaboration is mostly shared state
RCS does not present the Nightjar investigation as a document passed from one analyst to another. Collaboration happens through shared group visibility and mutations to common objects: target names, configurations, evidence notes and relevance, report flags, entities, handles, links, and queued requests. Other state remains personal, notably dashboard pins and alert rules.
That mixture can surprise a team. One analyst’s evidence note is visible to another user with access to the target; one analyst’s alert is not. A group change can alter access to the operation, while an already active privilege snapshot can survive an account change. A task created by one user can be invisible to another because the backend task manager is per-user and its list method is broken in this snapshot.
A handoff should therefore state more than “open Nightjar.” It should identify the saved evidence filter, relevant record identifiers, notes and report changes, entity assertions, outstanding queues, personal alerts that need to be recreated, and the time of the analyst’s last view. Audit and session records can help reconstruct that handoff, but neither substitutes for explicit case reasoning.
System administration frames the case
The System section is privilege-gated and normally belongs to specialist roles, but its state shapes every investigation. Frontend displays collectors and anonymizer chains. Backend shows shards and database statistics. Backup shows scheduled jobs and archives. Network Injectors and Connectors describe delivery-edge and export configuration.
The Nightjar fixture creates representative system records so these views are not empty: a fictional injector, a local JSON connector scoped to Nightjar, and a nightly full backup job. They are stored configuration only. No injector process is run, no traffic is altered, no connector exports real evidence, and the chapter does not execute a restore.
For an analyst, these sections answer provenance questions. Which collector path was supposed to receive data? Which shard should hold the target’s collections? Could a connector have copied the record elsewhere? Was a backup scheduled before deletion? For a defender, they identify additional hosts, credentials, logs, and archives that may need preservation.
The administrative view also exposes uncertainty. A configured connector need not have run successfully. A backup job need not have completed. A topology diagram is application state, not a verified network map. Chapter 9 examines the deployment edge from source and manuals without activating it.
One workflow, several kinds of proof
The reconstructed Nightjar investigation can be summarized as a loop:
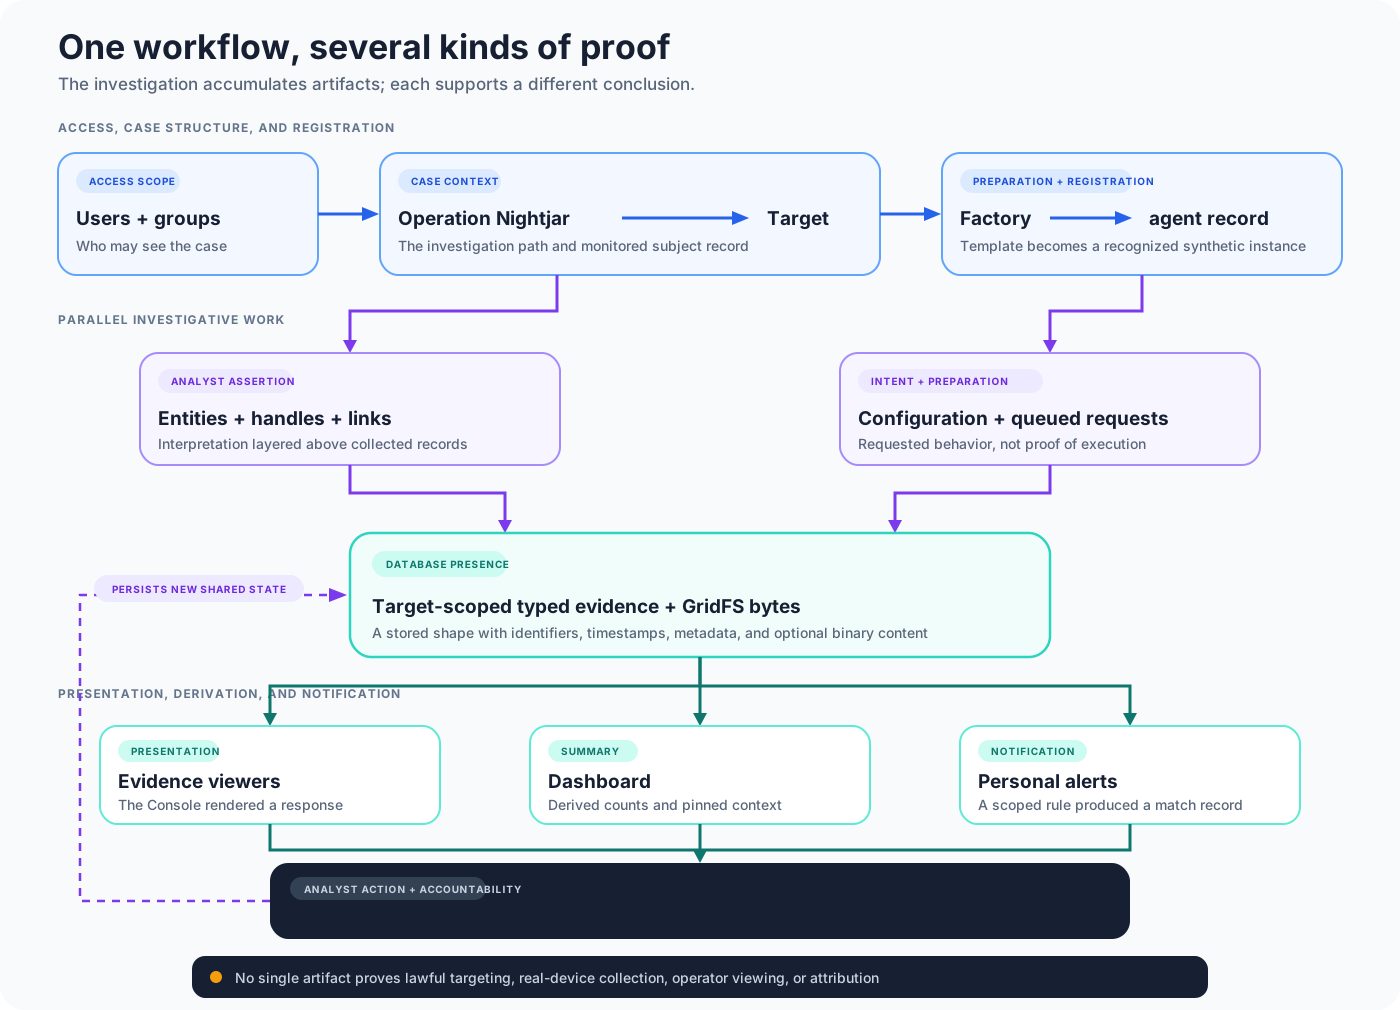
Every arrow needs its own evidence. A factory configuration proves preparation. An agent record proves backend registration. A queued request proves intent. A stored evidence document proves database presence in a particular shape. A GridFS file proves associated bytes were stored. An alert log proves the alert collection contains a match record. A console screenshot proves the web port rendered what it received.
None of those statements alone proves that a historical person was lawfully targeted, that a real device produced the bytes, that an operator saw the screen, or that a customer acted at HackingTeam’s direction. The clean visual hierarchy can conceal these epistemic gaps unless the provenance labels remain attached.
That is the value of rebuilding the workflow defensively. It reveals RCS as an enterprise process for turning collection into durable investigative state, while also showing where intent, execution, storage, interpretation, and attribution diverge. The following chapter moves outward from this analyst view to the collectors, anonymizers, injectors, and connectors at the platform edge—components this lab studies without operating.
Sources and evidence
- SOURCE: investigation, agent, evidence, request, entity, dashboard,
alert, audit, and system controllers/models in
rcs-dbcommit6cff59d28634d718cac9fdd17cb629fd59a3cf3f. - SOURCE: matching AIR views and service contracts from the frozen
rcs-consoleandrcs-console-librarycommits listed in Appendix I. - SOURCE/METHOD:
research/hackingteam-rcs/IMPLANT-CAPABILITY-AUDIT.mdchecks which configuration-visible endpoint families have registered, concrete, and writer-backed source paths. - MANUAL: RCS 9 Analyst, Technician, Administrator, and System Administrator guides, cross-checked through the 38-claim manual audit.
- LAB/WEB PORT: the fictional Operation Nightjar fixtures,
seed-demo.js, M0–M7 mock/live tests, and synthetic Worker evidence path. - LIMITATION: every person, message, location, credential, target, and operation in the walkthrough is synthetic; queued intent and stored state do not prove historical collection or operator action; endpoint source presence does not close that proof gap.
↑ HackingTeam's RCS: Bringing a Commercial Spyware Platform Back to Life