7. From Synchronization to Stored Evidence
An RCS operator did not receive a folder of raw implant output. By the time a record appeared in the Evidence grid, several systems had already decided which agent it belonged to, decrypted and decoded it, extracted searchable terms, separated binary content, updated counters, evaluated alerts, and placed optional work into other queues.
That transformation is the center of the product. The implant might have collected a keystroke, photograph, file, location, or message, but the backend turned it into something an analyst could filter, tag, annotate, export, delete, and connect to an investigation. It also created a second problem: RCS had to preserve the confidentiality and integrity of an unusually sensitive database while letting many asynchronous components modify it.
I followed that backend path without running an implant. The source supplies the original data flow; the isolated lab lets me test selected backend behavior with synthetic agents and evidence. I used two deliberately different routes. Most demonstration rows went straight into MongoDB through the old driver so I could exercise the Console safely. A narrower test sent a synthetic encrypted record through Worker decoding and alert processing.
The resulting rows can look alike in the Console. Their histories are not alike, and they support different conclusions.
Three meanings of “evidence arrived”
The reconstruction uses three evidence sources:
| Source | What it proves | What it does not prove |
|---|---|---|
| Original source code | The intended framing, decoding, storage, queue, deletion, and backup paths existed | That a historical deployment exercised them exactly this way |
| Direct database fixtures | The frozen server and console can query, render, update, and delete records in the expected MongoDB shape | Collection, collector transport, decryption, or worker decoding |
| Named synthetic Worker ingestion | The automated replay confirms backend acceptance, DEVICE decode/store, alert logging, and console push | No real implant, collector, anonymizer chain, target machine, or media transformation is involved |
The three sources meet at storage, but they reach it by different paths:
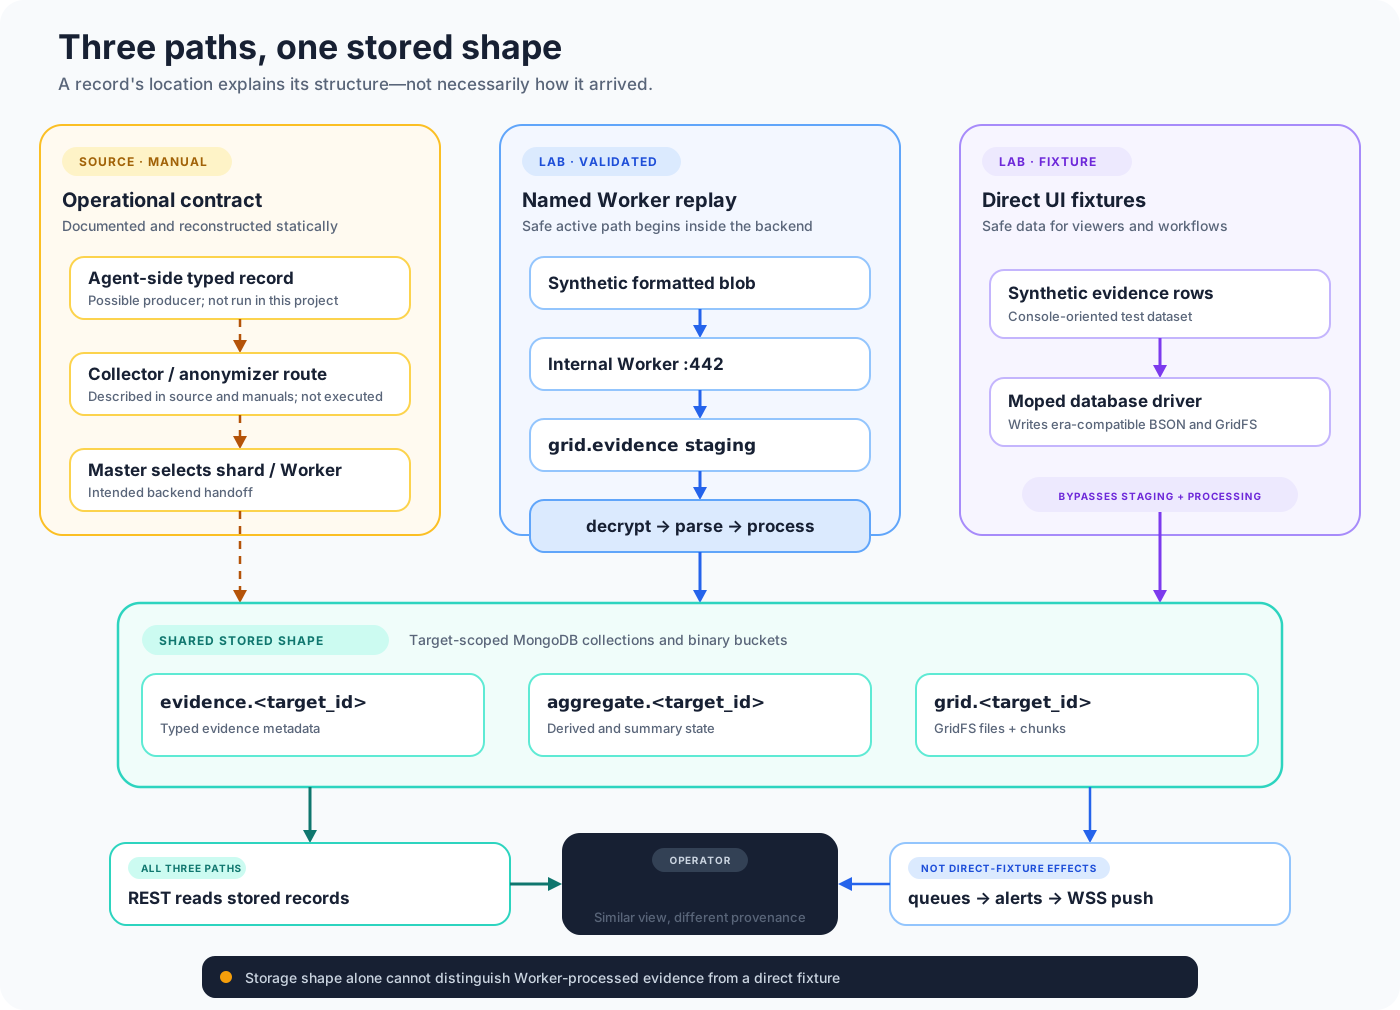
The upper-left path comes from source and manuals and stops before any excluded component is run. The center path is the bounded Worker test. The lower path supplies most rows used to validate viewers and workflows. I kept the routes separate in the test record because the final collection may not distinguish the last two reliably. BSON shape is not provenance.
This separation matters because direct insertion is deliberately easier than reconstructing the operational collection chain. The live console fixtures write through Moped, the same era of MongoDB driver used by the server. They set the agent identifier as a string, create the target-specific collections, and store binary material in the target’s GridFS bucket. That is sufficient to test the backend contract. It is not an implant simulation.
The backend implements that boundary by manufacturing a target-specific model whose collection name combines the model prefix and target identifier:
# rcs-db/lib/rcs-db/target_scoped.rb:17-20,42-46
def collection_name
  check_collection_name
  "#{collection_prefix}.#{@target_id}"
end

new_class.define_singleton_method(:storage_options) {
  storage_options.merge(store_in: {collection: collection_name})
}
For the Evidence model this produces evidence.<target-id>. The excerpt shows
how records are partitioned. It says nothing about whether every route that can
name the collection performs the right authorization check.
The project never builds or executes core-*, scout, soldier, or delivery
code. It also does not expose the worker to the host. The active boundary
begins at the backend’s synthetic ingest path.
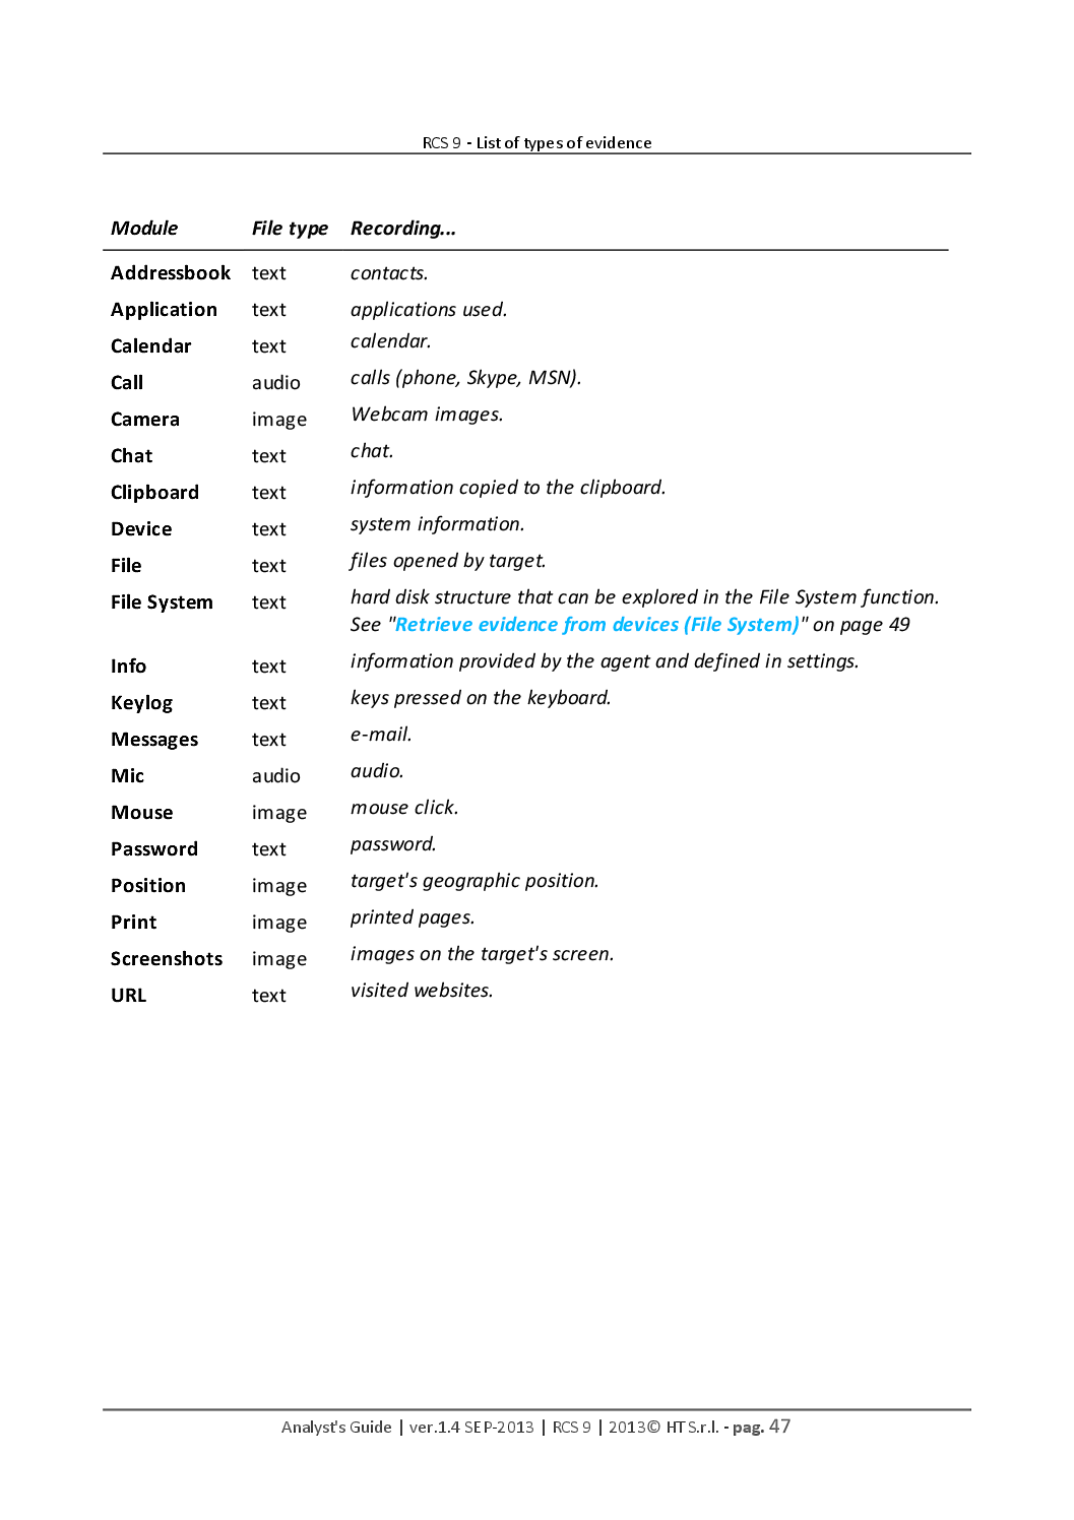
Static endpoint review nevertheless clarifies what can appear on the left side of the diagram. Registered modules with concrete evidence writers produce families such as messages, contacts, calls, device state, location, visual and audio captures, credentials, user input, URLs, files, and application activity. Those source paths explain why the backend has many evidence decoders; they do not validate transport into the Worker. The platform matrix in Appendices D–E keeps implemented paths separate from conditional, disabled, referenced-only, and unresolved ones, while this chapter begins only where a synthetic blob has already reached Worker staging.
Synchronization establishes context
Evidence cannot be interpreted in isolation. The worker identifies an agent
from the ident:instance name attached to an incoming blob. Its
InstanceWorker queries for an open agent with that pair and resolves the
agent’s parent target (lib/rcs-worker/instance_worker.rb:42-81). If the agent
or target is missing, the worker treats the queued raw material as orphaned
and deletes every raw blob for that identity.
The agent itself normally becomes concrete during first synchronization. A
factory is a reusable template; the status route clones it into an agent
instance identified by the factory ident and a device instance value. That
transition also creates runtime statistics used later by evidence creation and
deletion. In the lab, the same status route can deploy a synthetic instance
without transferring an implant.
Synchronization start updates the agent’s version, source address, device and
user strings, last-sync time, and status. It propagates last-sync state to the
target and operation, resets dashboard counters, checks synchronization
alerts, and inserts an ip evidence record for the observed source address
(lib/rcs-db/rest/evidence.rb:226-306). Synchronization stop returns the
status to idle; timeout marks it separately. These lifecycle records explain
why an analyst can see fresh activity before opening any collected content.
The version mismatch described in Chapter 3 is visible here. The database
stores ip among four special evidence types excluded from ordinary evidence
statistics. The 9.6 console library asks for a sync_history action that the
9.2.3 controller does not contain; the older backend exposes an ips method
instead. In this reconstructed pairing, Sync History is consequently empty
even though synchronization addresses can exist in MongoDB.
The backend lifecycle can be summarized as a state machine:
open factory
    │ first status for ident + new instance
    ▼
deployed agent (idle)
    │ synchronization starts
    ├── update device/user/address/version
    ├── create IP record
    ├── update operation/target/agent activity
    ▼
synchronizing
    ├── normal stop ──────────────> idle
    └── missed completion/timeout ─> timeout state
Identity, lifecycle, and evidence are therefore related but not identical. A deployed database agent proves that the status transition occurred. An IP record proves that the backend recorded an address in that transition. Neither fact proves that useful evidence followed, and evidence stored later does not by itself prove which public endpoint or route delivered it.
This distinction also affects chronology. The first status transition, the start of a later synchronization, staging arrival, evidence acquisition time, evidence receive time, and final alert time can all differ. A reconstruction that sorts only by one field can put backend processing before the activity it represents or hide a delayed batch behind a recent receipt timestamp.
The worker is a staging and decoding service
The database assigns an agent instance to a shard by taking the CRC32 of its
ident:instance string modulo the shard count. A collector can request that
worker address from the authenticated /evidence/worker action
(lib/rcs-db/evidence_dispatcher.rb:20-34 and
rest/evidence.rb:59-72). Imported evidence follows a simpler local path: the
database forwards it to the worker on the port immediately below the database
HTTPS port.
The standalone worker listens on TLS port 442 by default. In the original
source it binds to all interfaces and accepts POST /evidence/{ident}:{instance}.
The lab runs it as an internal-only compose service with no host-published
port. This is a deployment guardrail, not an application authentication
control: the worker controller itself does not authenticate the request before
storing its body (lib/rcs-worker/events.rb:114-143 and
worker_controller.rb:8-25). Chapter 10 discusses the resulting resource
exhaustion risk.
The incoming body first enters a staging GridFS bucket named
grid.evidence. The filename is the agent UID, and metadata records an
arrival time. A per-instance worker fetches at most 100 staged files at a time,
oldest first, and exits after five idle minutes
(instance_worker.rb:25-60). This makes the raw encrypted blob a temporary
queue item rather than the analyst-facing record.
For a valid agent, the decryption key is the binary MD5 digest of the agent’s
stored logkey (instance_worker.rb:83-87). The common library uses
AES-128-CBC with a zero initialization vector; evidence chunks use block
alignment without ordinary padding (rcs-common/crypt.rb:15-36 and
rcs-common/evidence.rb:73-91). Each evidence header records its type,
acquisition time, device, user, source, and type-specific header length. The
decoder then walks the encrypted content chunks and extends the evidence
object with the parser for its type.
This confidentiality design has two notable limits. A fixed IV makes equal
first blocks under one key observable, and the ordinary evidence encryption
path does not add the SHA-1 integrity construction available elsewhere in the
same crypto helper. More importantly, the evidence decoder can switch to an
embedded global import key when the high bit of the first length field is set
(rcs-common/evidence.rb:168-181). The complete security consequence of that
cross-repository branch remains a follow-up assessment; the book does not
publish the key literal.
After decoding, the worker performs type-specific processing, generates a
keyword index, and chooses a processor. Calls and microphone recordings have
special processors; most records use SingleProcessor. If a type supplies
duplicate criteria, the worker looks for a matching record in the destination
target collection before storing it (lib/rcs-worker/evidence/single_evidence.rb:14-34).
Whether decoding succeeds or fails, the worker normally deletes the staged
raw blob. Failed decoded bytes can be written to a local decoding_failed
directory for diagnosis, named with the agent and raw object identifiers
(instance_worker.rb:163-210). That directory is an important forensic
exception: material that never became analyst-visible evidence may survive on
the worker filesystem even after the staging record is gone.
The staging-to-record transition has several distinct failure classes:
| Stage | Failure example | Likely surviving evidence |
|---|---|---|
| Identity resolution | Unknown or closed ident:instance, missing target | Worker trace and possibly short-lived staging metadata; source deletes that identity’s staged blobs |
| Key derivation/decryption | Missing key material, malformed length, block error | Trace plus optional decoding_failed bytes; no normal target document |
| Type parsing | Unsupported or malformed type-specific fields | Failure file and parser trace, depending on the exception path |
| Deduplication | Matching type-specific criteria already exist | Existing destination record; the new staged object is still consumed |
| GridFS write | Binary storage fails after metadata processing begins | Partial file/chunk state or an exception, requiring collection correlation |
| Queue fan-out | Storage succeeds but an optional subsystem fails | Analyst-visible evidence may exist without expected OCR, intelligence, connector, or alert result |
This table describes source paths, not a complete fault-injection campaign. It is useful because “not visible in the Console” spans failures before storage, after storage, and in presentation. A responder should preserve the staging bucket and worker filesystem before restarting the service: normal processing is designed to consume both the queue item and much of the evidence about why it failed.
One collection and one binary bucket per target
Ordinary evidence is not stored in one global collection. The TargetScoped
model duplicates the Evidence class for a target and changes its collection
name to evidence.<target_id> (lib/rcs-db/target_scoped.rb:1-52). Creating a
target prepares three related namespaces:
evidence.<target_id>for evidence metadata and ordinary content;aggregate.<target_id>for derived correlations; andgrid.<target_id>.filesplusgrid.<target_id>.chunksfor binary data.
global application database
├── items
│   └── target T
│       └── agent A
├── alerts / audit / backups / queues
│
├── evidence.T                  shard key: type + da + aid
│   ├── record E1 (inline data)
│   └── record E2
│       └── data._grid ──→ references GridFS file F
├── aggregate.T                 shard key: type + day + aid
├── grid.T.files
│   └── GridFS file F
│       └── metadata for evidence record E2
└── grid.T.chunks
    ├── chunk 0 ── files_id → GridFS file F
    └── chunk N ── files_id → GridFS file F

worker staging database
└── grid.evidence.files/chunks
    └── raw encrypted queue, keyed by agent UID
The diagram exposes two joins that a normal Console view hides. The first joins
the evidence record’s aid string to the deployed agent and its target path.
The second joins _grid to a GridFS file document and then to every chunk with
that files_id. Losing either join leaves data without context or context
without content.
The evidence collection is sharded on {type, da, aid}: evidence type, date
acquired, and agent identifier (db_objects/evidence.rb:19-48). The GridFS
chunks are sharded by their file identifier (rcs-db/lib/rcs-db/grid.rb:20-31). Collection
names therefore preserve target identifiers directly, a useful database-level
fingerprint during incident response.
Each evidence document contains two times. da is the acquisition time
reported in the evidence header; dr is the receive time assigned during
decoding. It also stores type, relevance rel, the report/blotter flag
blo, analyst note, agent identifier aid, a type-specific data hash,
and keyword array kw. Binary evidence does not sit inline in that hash. The
worker writes it to the target’s GridFS bucket and saves _grid and
_grid_size references in data
(lib/rcs-worker/evidence/single_evidence.rb:36-66).
Those fields belong to different provenance classes:
| Field or relationship | Primary origin | Interpretation caution |
|---|---|---|
type, da, device, user, source, type-specific content | Decoded evidence header/body | Values originate upstream and may reflect device-controlled clocks or strings |
dr | Worker processing | Backend receipt/decoding time, not activity time |
aid and target collection name | Backend identity resolution | Links the record to RCS’s model; does not independently authenticate the monitored person |
kw | Worker indexing | Derived search material, not a verbatim field from the original activity |
_grid, _grid_size | Worker/GridFS storage | Reference and expected size; completeness requires file/chunk validation |
rel, blo, note | Analyst or later application workflow | Post-collection assertions and annotations |
| cached statistics | Model callbacks and recalculation | Convenience totals that can lag, fail, or exclude pseudo-view types |
Preserving provenance at field level prevents two common mistakes. A receive timestamp should not be presented as the moment an event occurred, and an analyst note should not be presented as content recovered from a device. Both can be important evidence, but they answer different questions.
The aid field is explicitly a string, not a BSON ObjectId. That detail is
more than schema trivia. Because the collection’s shard key includes aid, a
fixture written with the wrong BSON type can appear to update successfully in
Mongoid while the database does not persist the change. The live fixture uses
Moped and the string representation precisely to match the old server. BSON
type is consequently one clue—not absolute proof—when distinguishing
worker-shaped rows from careless later insertion.
Evidence creation updates counters on the agent and target, plus size totals
on the operation. Binary length is tracked separately. Four pseudo-view types
are exceptions: filesystem, info, command, and ip do not contribute to
normal evidence or dashboard counters (db_objects/evidence.rb:19-74). That
explains why raw collection counts can disagree with the totals shown in the
console without either necessarily being corrupt.
Integrity checks the storage model enables
The examined format is not cryptographically tamper-evident, but its redundant relationships support useful consistency checks. None proves authenticity on its own; together they can identify records that deserve deeper examination.
| Check | Expected relationship | A discrepancy may indicate |
|---|---|---|
| Collection ancestry | Target ID in evidence.<target_id> agrees with the agent’s target path | Misfiled or directly inserted record, stale path, or deliberate manipulation |
| Agent type | Evidence aid is the expected string form and resolves to a deployed agent | Fixture/tool type error, orphaning, deletion, or fabricated association |
| Binary reference | _grid resolves to one file and all chunks; assembled length agrees with _grid_size | Partial acquisition, failed cleanup/write, or altered metadata/chunks |
| Time ordering | Acquisition, receipt, GridFS, queue, alert, and audit times form an explainable sequence | Clock skew, delayed batches, retry, direct insertion, or timestamp alteration |
| Statistics | Agent/target/operation counters reconcile after accounting for exclusions | Interrupted callback, failed recalculation, wrong BSON type, or unsupported mutation |
| Queue fan-out | Applicable licensed branches have explainable queue/output state | Consumer failure, disabled feature, policy mismatch, cleanup, or tampering |
| Backup comparison | Live identifiers and hashes can be compared with earlier archives | Legitimate change, deletion, restore, or post-backup modification |
These checks should be run against preserved copies. Recalculating statistics, restoring an archive, or opening evidence through a workflow that updates state can destroy the very inconsistency under investigation. The incident-response chapter therefore begins with acquisition and read-only inventory rather than using the Console as a repair tool.
From stored record to queues and alerts
Storage is not the end of ingestion. Evidence#enqueue fans a new record into
licensed subsystems (db_objects/evidence.rb:105-138). In order, it can:
- pass the evidence to configured connectors and stop local processing if every matching connector says not to retain it;
- test per-user alerts;
- enqueue images or captured files for OCR;
- enqueue translatable evidence and mark translation state;
- enqueue correlation work;
- enqueue selected types for intelligence processing; and
- send dashboard updates for ordinary evidence types.
These branches have different outputs and retention implications:
| Branch | Input relationship | Output or state | Forensic question |
|---|---|---|---|
| Connector | Rule matches the agent/investigation path and type | External queue item and possibly later local deletion | Did an external copy complete, fail, or outlive the source? |
| Alert | Per-user path, type, keyword, and membership match | Queue entry, embedded log, push, optional email | Was the user eligible at trigger time, and was suppression active? |
| OCR | Licensed image or file type | Extracted/searchable derivative | Can the derivative be tied to the original binary and decoder version? |
| Translation | Licensed translatable type | Translation state and derived text | Which language/tool produced it, and was the source preserved? |
| Correlation/intelligence | Supported structured evidence | Aggregate, entity, handle, link, or location state | Is the result collected fact, automated inference, or analyst assertion? |
| Dashboard | Counted evidence type | Updated counters and push state | Does the displayed total reconcile with raw rows and exclusions? |
Fan-out is not a transaction across every branch. A stored evidence record can remain valid even when one optional consumer fails, and a queue flag may mean processed rather than pending. Investigators should correlate timestamps and identifiers across queues instead of assuming that absence of an alert or dashboard increment means absence of ingestion.
Alerts are user-owned objects, not a global policy. For an evidence alert, the
server finds the agent, checks whether the alert path is contained in the
agent’s operation/target/agent path, compares the evidence type and keyword
pattern, and confirms that the alert’s owner remains among the agent’s users
(lib/rcs-db/alert.rb:68-111). A matching alert can raise the evidence
relevance tag before placing work in alert_queue.
The dispatcher polls that queue. Outside the alert’s suppression window it creates an embedded alert log, updates the last-triggered time, sends a push to the user’s console, and optionally sends mail. Inside the window it appends the evidence identifier to the most recent log rather than creating a new one. A subtle diagnostic trap follows from queue handling: the queue flag is changed before the informational count is logged, so a message saying zero alerts remain can accompany successful processing rather than a stuck queue.
The named worker-ingestion.live.spec.js replay now exercises this backend
chain with one synthetic encrypted DEVICE record: internal Worker acceptance,
decoding and storage, alert evaluation, queue dispatch, an embedded alert log,
and a console push. The sanitized reproduction record is
research/hackingteam-rcs/WORKER-VALIDATION.md. The replay begins at Worker
ingress, runs no implant or collector code, and does not validate media
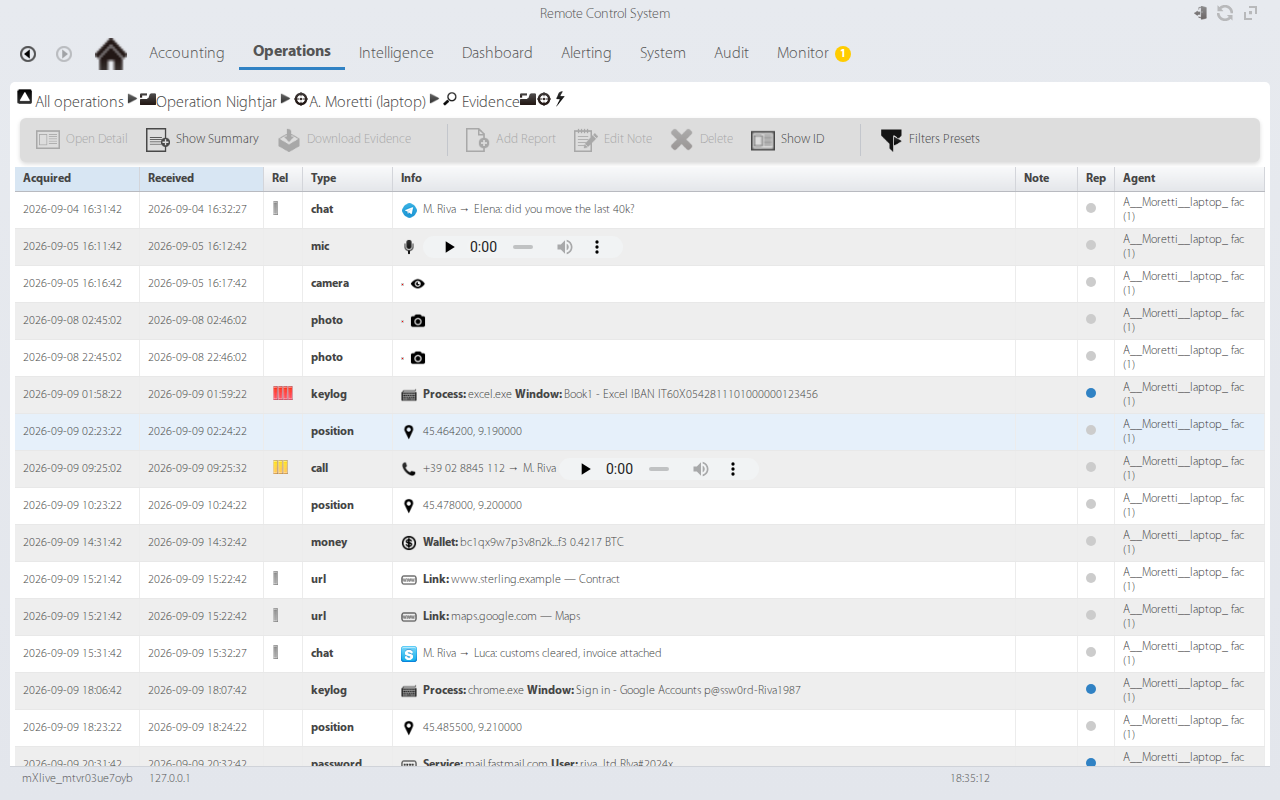
transforms. The ordinary demo dataset is different. Its dozens of evidence rows are inserted through Moped, and its
illustrative alert logs are constructed in the same stored shape because
direct insertion bypasses Evidence#enqueue. A screenshot of those rows is UI
evidence, not proof that the worker processed them.
Reading and filtering evidence
The generic evidence index defaults to the last 24 hours and filters on
acquisition time unless the caller selects receive time. Presets can select a
week, a month, “now,” or an unlimited range. Filters can narrow by target,
agent, type, relevance, report flag, keyword groups, notes, and geographic
coordinates (db_objects/evidence.rb:245-353). The controller removes large
bodies from list results and returns the response compressed with gzip
(rest/evidence.rb:418-449).
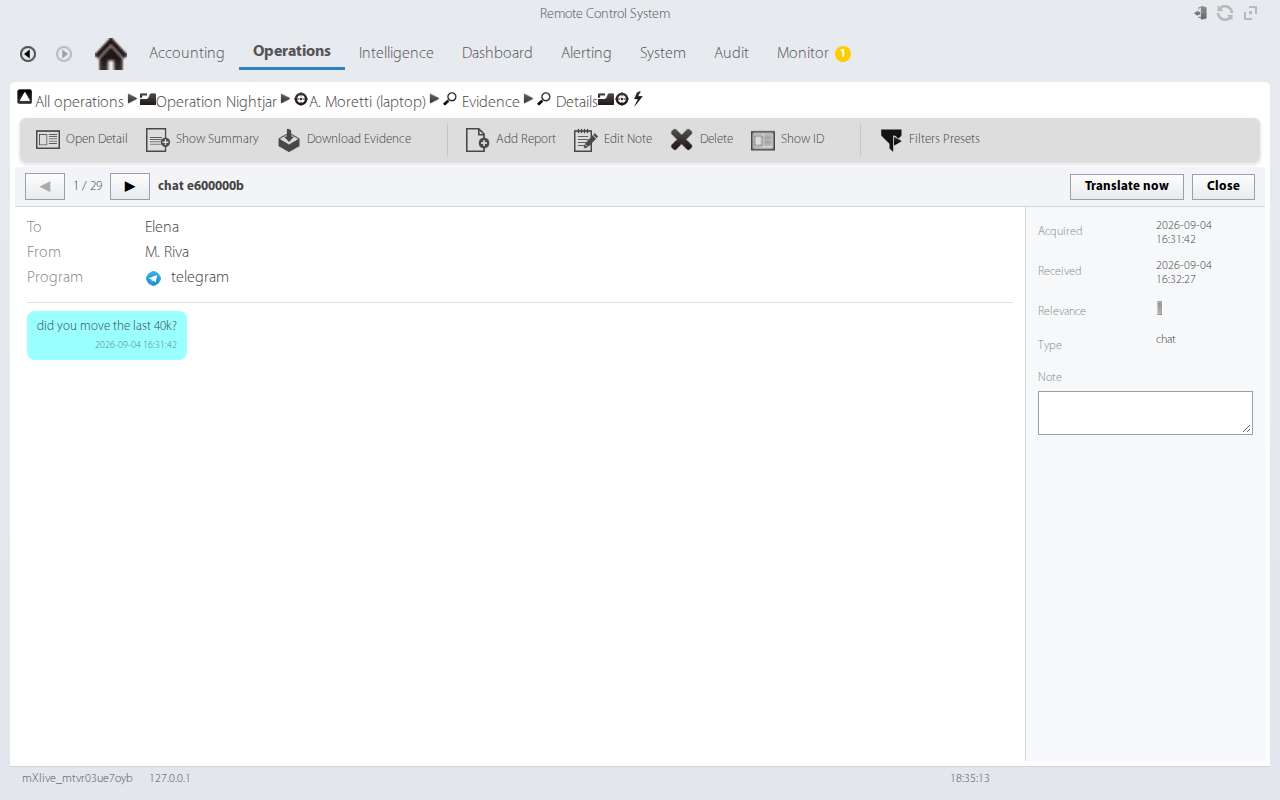
Separate actions serve filesystem, command, info, and IP records because the generic index excludes them. The filesystem route builds a one-level path regular expression and de-duplicates results in the application rather than MongoDB. Binary viewers retrieve content through GridFS. Message bodies have a separate HTML response path.
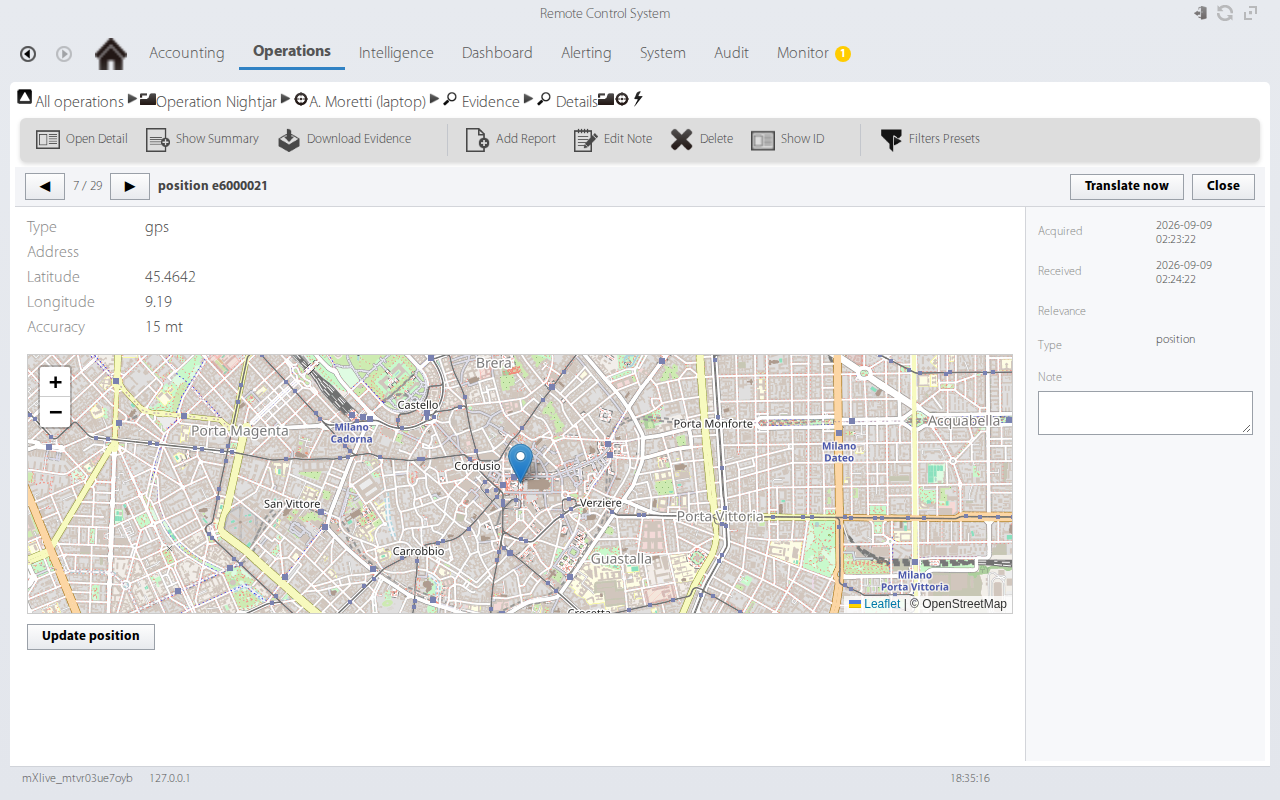
This is where storage design and authorization collide. Selecting a target collection is not itself an access-control check. The generic filter and several direct routes locate a target by identifier without requiring that the target contain the caller’s user ID. Mutation routes likewise enforce a functional evidence privilege without consistently verifying investigation membership. Chapter 10 records the resulting cross-investigation read, modification, deletion, and GridFS findings. Per-target collections are labelled filing cabinets, not locks. They provide organization and sharding, not a security boundary.
Deletion is a family of workflows
RCS does not implement one universal evidence-retention setting. Data leaves the system through several paths with different prerequisites and side effects.
Single-evidence deletion requires the evidence-delete privilege and a
licensed deletion feature. The controller decrements cached agent statistics,
writes one audit entry with the evidence type and identifier, destroys the
document, and lets the model callback remove associated GridFS content
(rest/evidence.rb:155-176; db_objects/evidence.rb:75-98). The callback
also updates target and operation sizes.
Bulk deletion accepts a target, optional agent, relevance selection, date
field, and time range. It logs the filter as one audit event, hands an
offloaded task to Evidence.offload_delete_evidence, destroys matching rows,
and recalculates statistics (rest/evidence.rb:179-202;
db_objects/evidence.rb:442-472). The log preserves the request criteria but
not a durable list of every deleted evidence identifier.
Agent deletion removes evidence matching the agent ID from the target
collection. Target deletion takes a faster path: it destroys descendants
and drops the target’s entire evidence, aggregate, and GridFS collections.
Operation deletion cascades through its targets
(db_objects/item.rb:541-609). Closing an item is different from permanent
deletion; a closed operation can remain available and can be included in a
backup.
Connector discard is asynchronous. If matching connectors all specify
that evidence should not be kept, the server sets a destruction countdown
equal to the number of connector jobs. Each queue record’s destruction
decrements that count, and the final one destroys the evidence
(connector_manager.rb:10-31; db_objects/connector_queue.rb:25-35). This
design aims to keep evidence until every export has finished, but it also
means queue correctness controls local retention.
Alert logs have their own lifecycle. The server runs an hourly cleanup
that destroys embedded logs older than seven days
(rcs-db/lib/rcs-db/events.rb:271-276;
rcs-db/lib/rcs-db/db_objects/alert.rb:49-56). Operators can also delete
one alert log or all logs for one of their alerts. Deleting an alert removes
its logs; changing its path clears prior logs. These are not copies of the
evidence itself, but their disappearance removes part of the record of who
was notified and when.
There is no comparable automatic age-based purge for ordinary backend evidence in this snapshot. The manuals advise analysts to delete old or large evidence and describe filters for doing so. A separate technician command can request deletion of evidence still on a device before transmission, but that is endpoint configuration and remains outside the active lab. Server-side retention is chiefly operator action, lifecycle cascades, connector policy, and whatever backup policy preserves.
The resulting retention matrix is deliberately uneven:
| Action or policy | Evidence document | GridFS binary | Aggregate/derived state | Audit/notification trace | External/archive copy |
|---|---|---|---|---|---|
| Delete one evidence item | Destroyed | Callback attempts deletion | May require separate derived-state handling | One item-level audit entry | Unchanged |
| Bulk evidence deletion | Matching rows destroyed | Callbacks attempt deletion | Statistics recalculated; other derivatives require checking | One filter-level audit entry | Unchanged |
| Delete agent | Rows for its aid destroyed | Associated callbacks run | Agent-related aggregates removed through model paths | Cascade context, not a per-row manifest | Unchanged |
| Delete target | Collection dropped | Entire target GridFS dropped | Target aggregate collection dropped | No enumeration of every removed row | Unchanged |
| Connector discard | Destroyed after all export jobs complete | Normal destroy callback applies | Depends on downstream processing order | Queue state, no explicit operator deletion event | Connector copy is the purpose |
| Alert-log cleanup | Evidence unchanged | Unchanged | Alert log removed | Notification history reduced | Unchanged |
| Metadata backup | Live state unchanged | Excluded | Most evidence-related state excluded | Archive/job audit context | Metadata archive created |
| Full or scoped backup | Live state unchanged | Included for selected targets | Included according to scope | Archive/job audit context | Recoverable archive created |
“Deleted” must therefore name both an action and a layer. A successful target drop is much broader inside the live database than a single-item deletion, yet neither reaches an earlier export or archive. Conversely, automatic removal of an alert log changes notification history without touching the underlying evidence.
Deletion also has failure modes. The single-delete route directly assumes an agent statistics object exists. A factory created only through REST may not have the statistics initialized during first synchronization, causing the route to fail before the evidence is removed. GridFS deletion in the model callback rescues errors, which favors completing metadata deletion even if a binary cleanup fails. Investigators should therefore check documents, statistics, files, chunks, dropped collections, and worker failure artifacts rather than infer complete erasure from a successful UI action.
Backup can preserve what the live database loses
The server ensures that at least one enabled metadata backup job exists. The
default job runs weekly at midnight and excludes evidence, aggregates, GridFS,
cores, sessions, status, licence state, logs, and queue collections
(rcs-db/lib/rcs-db/backup.rb:48-84,288-303). It protects configuration and structural metadata,
not collected content.
Full backups include evidence. Operation and target backups select the item
subtree and add each target’s evidence, aggregate, and GridFS collections.
Incremental jobs remember the latest BSON ObjectId per evidence-related
collection and later request records with greater identifiers
(rcs-db/lib/rcs-db/backup.rb:126-146,181-248). The manuals recommend frequent metadata
backups, periodic full or scoped backups, and restoring incremental sets in
sequence.
The backup is a filesystem directory produced by mongodump, accompanied by
an info file describing its job, scope, and incremental state. A full or
metadata backup also dumps MongoDB’s configuration database. The archive list
is reconstructed from directories under BACKUP_DIR; deleting a backup job
does not delete its previously generated archives. Archive deletion is a
separate privileged action with a path-containment check
(rest/backup.rb:111-141).
Restore runs mongorestore and can drop current collections when requested.
If the archive contains component signatures, the current signature
collection is dropped first. The manager rebuilds handle indexes and
recalculates affected item statistics afterward (rcs-db/lib/rcs-db/backup.rb:339-397). The
manual describes restore as non-destructive in the sense that it can merge
historical material, but the source’s optional --drop behavior and signature
replacement mean responders must preserve the current database before using
it.
Backups expand the evidentiary surface. A deleted live record may remain in a full, operation, target, or incremental archive. Conversely, the ordinary metadata backup cannot recover its content. Archives are not application-level encrypted or authenticated by this code; their protection depends on the backup destination, filesystem controls, and deployment. Chapter 10 separately describes authorization and command-construction flaws in create and restore.
Audit records are useful but not complete
RCS stores audit documents in a global audit collection sharded by time and
actor. A record can contain action, actor, description, and denormalized user,
group, operation, target, agent, or entity names. Startup enables sharding and
the source comments that the collection “will increase its size forever and
ever” (rcs-db/lib/rcs-db/db.rb:77-94;
rcs-db/lib/rcs-db/db_objects/audit.rb:1-31). Unlike alert logs, no
automatic audit retention is visible in this snapshot.
Evidence annotation changes and single or bulk deletions generate audit
events. Backup job changes, archive restore, and archive deletion do too. The
audit API is limited to administrators with the audit sub-privilege, defaults
to the last 24 hours, supports filters, and returns gzip-compressed pages
(rest/audit.rb:15-73; db_objects/audit.rb:33-91).
The logger catches every exception and records only a trace if its own write
fails (rcs-db/lib/rcs-db/audit.rb:40-69). Business operations do not roll back when audit
storage fails. Audit entries are ordinary MongoDB documents protected by the
same backend and database boundary as the data they describe; there is no
cryptographic chaining or external append-only sink in the examined code.
Bulk deletion records criteria rather than a per-object manifest, connector
countdown deletion occurs in a model callback without an explicit operator
audit event, and target collection drops do not enumerate every removed
record. Audit is therefore valuable operational context, not a complete or
tamper-evident evidence ledger.
What an investigator should preserve
The storage model changes the order of incident response. Before logging into an unfamiliar system or restoring anything, preserve:
- the
items,users,groups,audit,alerts,backups, signature, and queue collections; - every
evidence.<target_id>andaggregate.<target_id>collection; - paired
grid.<target_id>.filesand.chunkscollections; - the worker’s
grid.evidencestaging bucket anddecoding_faileddirectory; - configuration, TLS material, log files, and the backup directory; and
- MongoDB topology and collection metadata, including shard keys and BSON types.
Preserve the relationships, not only visible evidence rows. An _grid
reference without its chunks is incomplete; chunks without the corresponding
file document need reconstruction; an agent ID without its operation/target
path loses access-control context. Compare cached statistics with raw counts,
but do not “repair” discrepancies before imaging them. A difference can record
a failed deletion, wrong shard-key type, direct fixture or attacker insertion,
or incomplete cascade.
The acquisition and receive times answer different questions. Sort on both. Acquisition time can reflect the observed device; receive time places backend processing. GridFS upload time, worker staging metadata, alert-log time, audit time, and backup directory creation time provide additional clocks. None should be treated as independently authoritative on a potentially compromised RCS host.
What this reconstruction establishes
The source-backed flow is clear: synchronization establishes an agent and context; encrypted blobs are staged by agent identity; a worker derives a key, decodes and processes records; metadata enters a target-specific sharded collection; binaries enter target-specific GridFS; queues feed alerts and optional analysis; and operators consume the result through filtered APIs.
In the lab, I confirmed that the old backend and reconstructed Console understand that storage model, that target-scoped documents and GridFS content can be rendered and changed, and that a synthetic encrypted record can cross the Worker-side processing path. The result stops there. It cannot establish real-world collection or historical use. The static capability audit closes a documentation gap about the possible producers of those types; it does not close the execution gap between an endpoint and this reconstruction.
The retention conclusion is equally important: “delete evidence” is not a single erasure event. Live metadata, binary chunks, raw worker staging, failure files, aggregates, alert references, audit records, connector exports, and backups each have their own lifecycle. For defenders, those layers offer recovery and corroboration. For the people represented in the database, they also show how difficult it is to know when surveillance data has truly ceased to exist.
Sources and evidence
- SOURCE:
rcs-dbevidence controller, evidence model, worker, target-scoping, GridFS, alerting, connectors, audit, item cascades, and backup manager at commit6cff59d28634d718cac9fdd17cb629fd59a3cf3f. - SOURCE:
rcs-common/lib/rcs-common/evidence.rbandcrypt.rbat commit38290d4eab2b2c295bea021429848a3666647827; this later common-library snapshot is subject to the version-skew limits in Chapter 3. - SOURCE/METHOD:
research/hackingteam-rcs/IMPLANT-CAPABILITY-AUDIT.mdmaps frozen endpoint registrations to implementations and evidence sinks; no endpoint-to-Worker path was executed. - MANUAL: RCS 9 Analyst guide, evidence deletion section; RCS 9 System Administrator guide, backup methods, archive, restore, and backup-management sections.
- LAB/WEB PORT:
docker-lab/README.md,docker-lab/IOCs.md, andconsole-web/MILESTONES.mdrecord the worker observation;tests/specs/live-evidence-seed.jsand the M3, M4, and M6 live suites cover direct fixture storage and UI workflows, not encrypted worker ingestion. - LIMITATION: synthetic backend data only; most display fixtures bypass worker ingestion; the named Worker replay covers DEVICE evidence only; no implant, exploit, collector, or injector execution.
↑ HackingTeam's RCS: Bringing a Commercial Spyware Platform Back to Life