2. Anatomy of a Surveillance Platform
RCS is easiest to misunderstand when reduced to “spyware.” The implant was one part of the product, but the product was an investigation system. It connected covert collection to users, permissions, target records, evidence processing, search, alerting, topology management, and backups. The leaked manuals describe both an all-in-one installation and a distributed deployment, and the source tree supplies the services behind those diagrams.
I use platform deliberately. The implant collected. The surrounding system made that collection repeatable, searchable, shareable, and administratively ordinary.
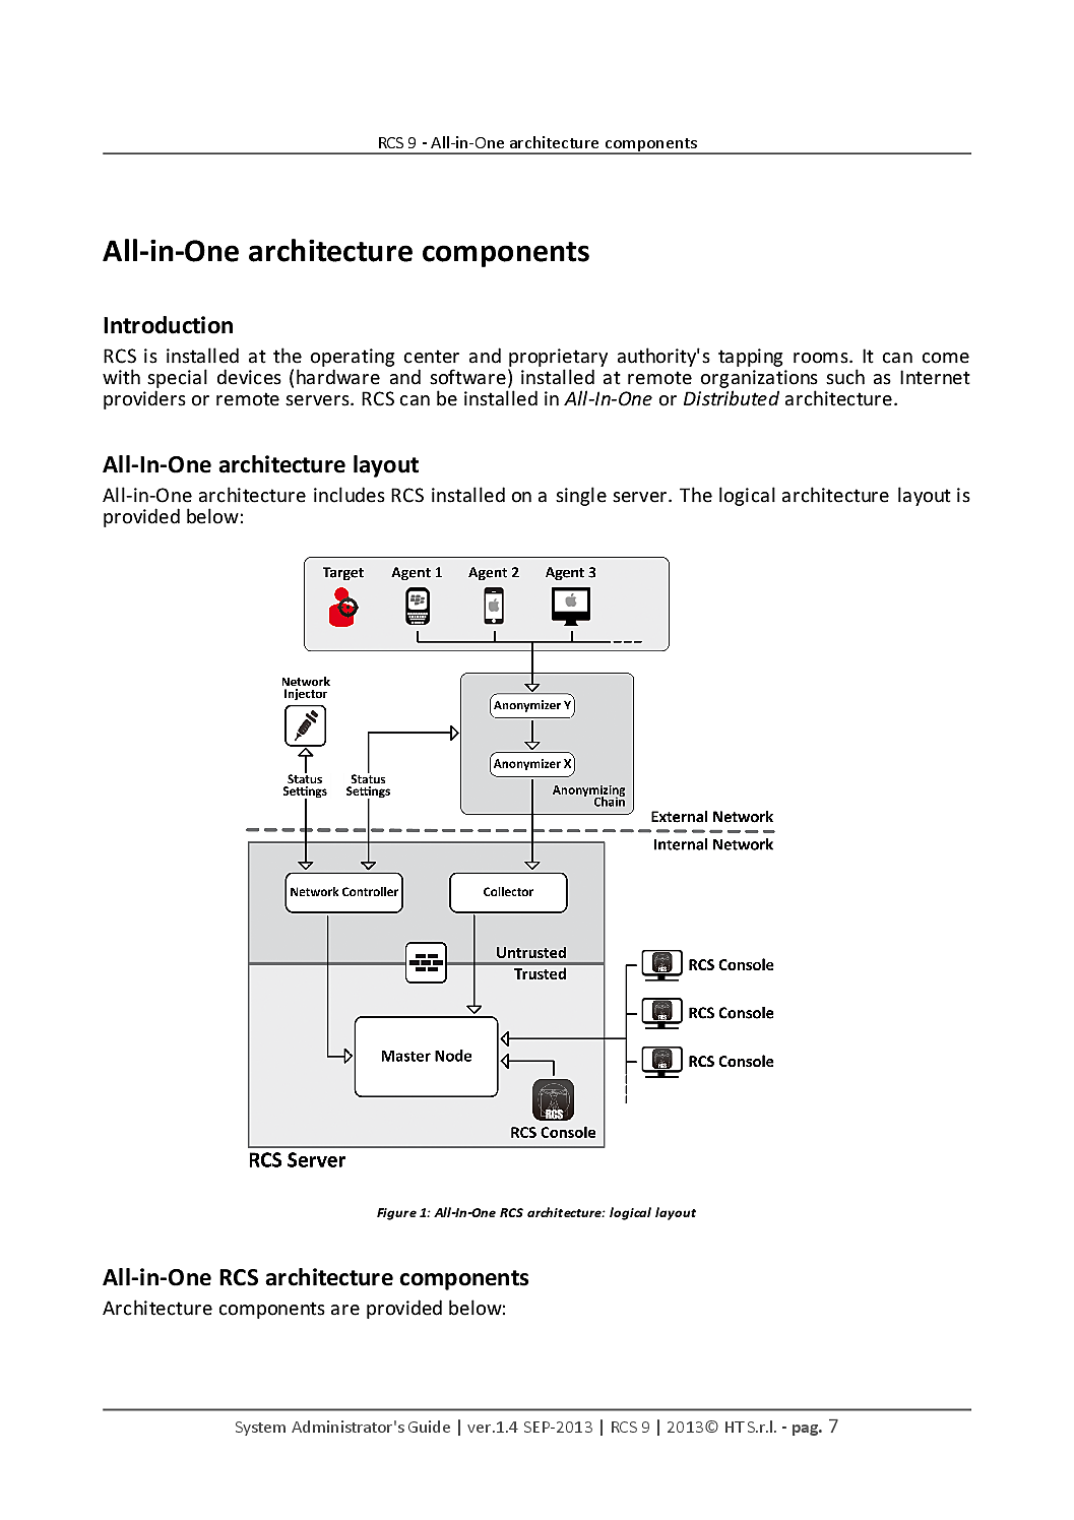
One product, two physical layouts
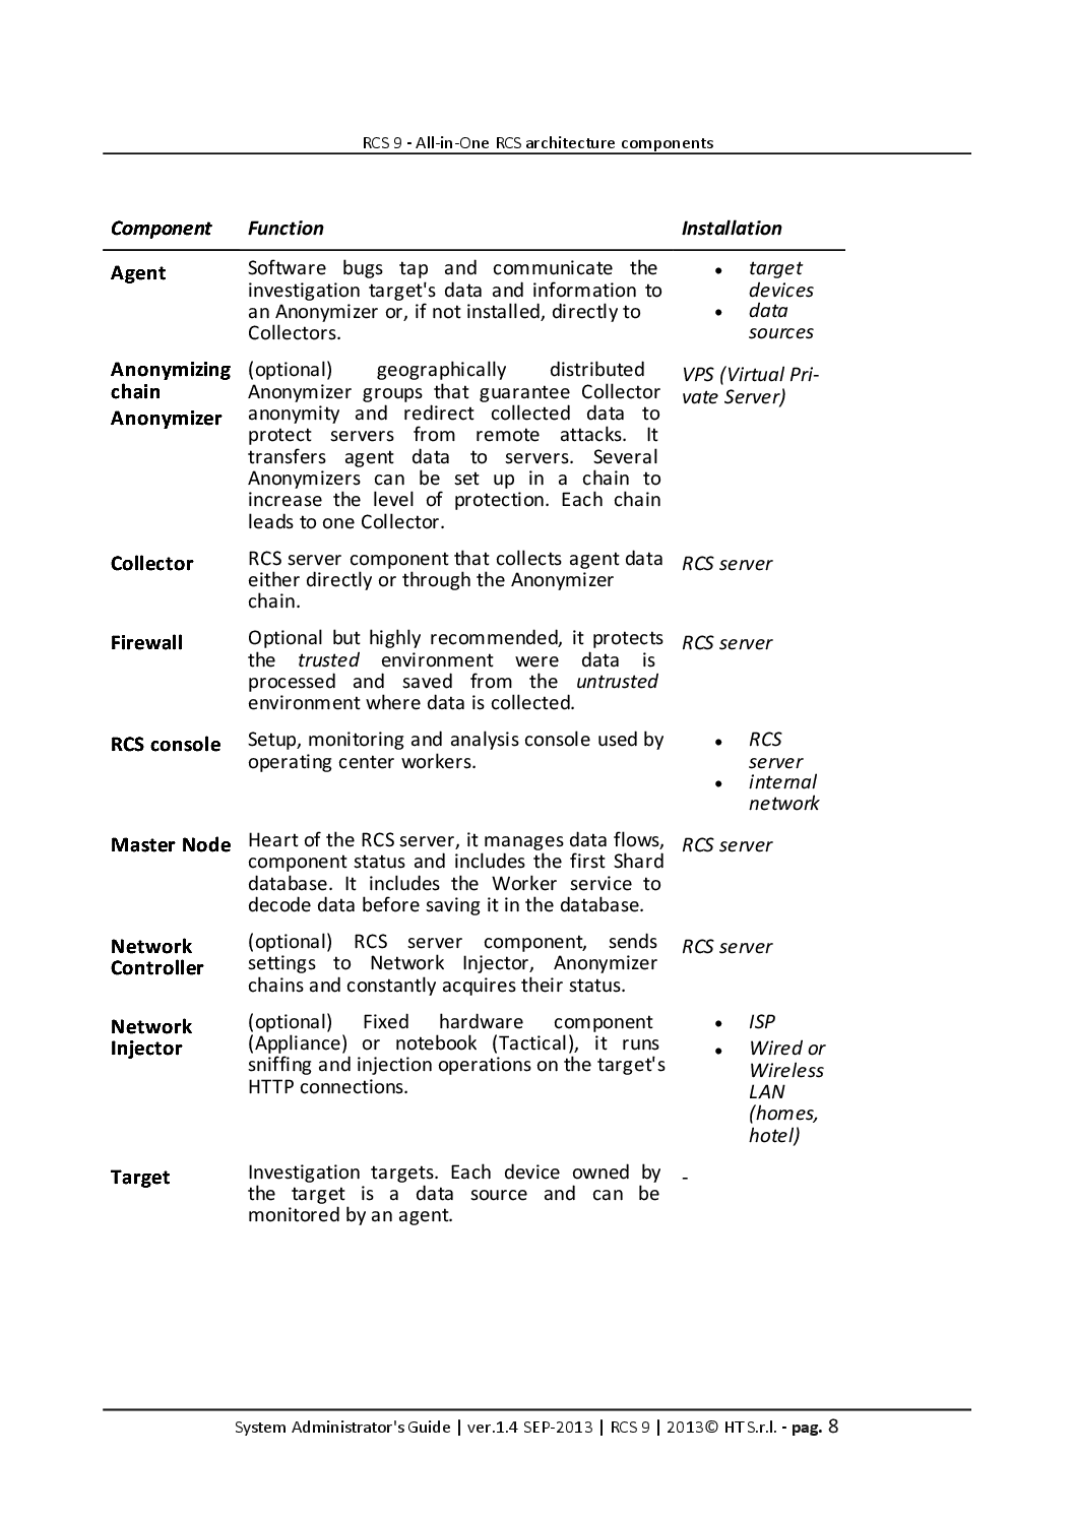
The System Administrator’s Guide presents two deployment patterns. The first, called All-in-One, concentrates the Master Node, the first database shard, and its Worker in one protected installation. That name can be misleading. It does not mean every RCS role lived on one computer or on one side of a firewall. The agent remained on the monitored device; an optional anonymizer chain could stand in front of the collector; and the collector remained the externally facing handoff point. Analyst consoles and optional Network Injector components also retained distinct roles.
The second pattern distributes the backend. Additional database shards each gain their own Worker, while a single Network Controller coordinates Network Injectors. The guide divides the platform into a public-facing front end and a protected back end, with a firewall separating them. Each anonymizer chain terminates at a collector, but several such paths can feed the same Master Node.
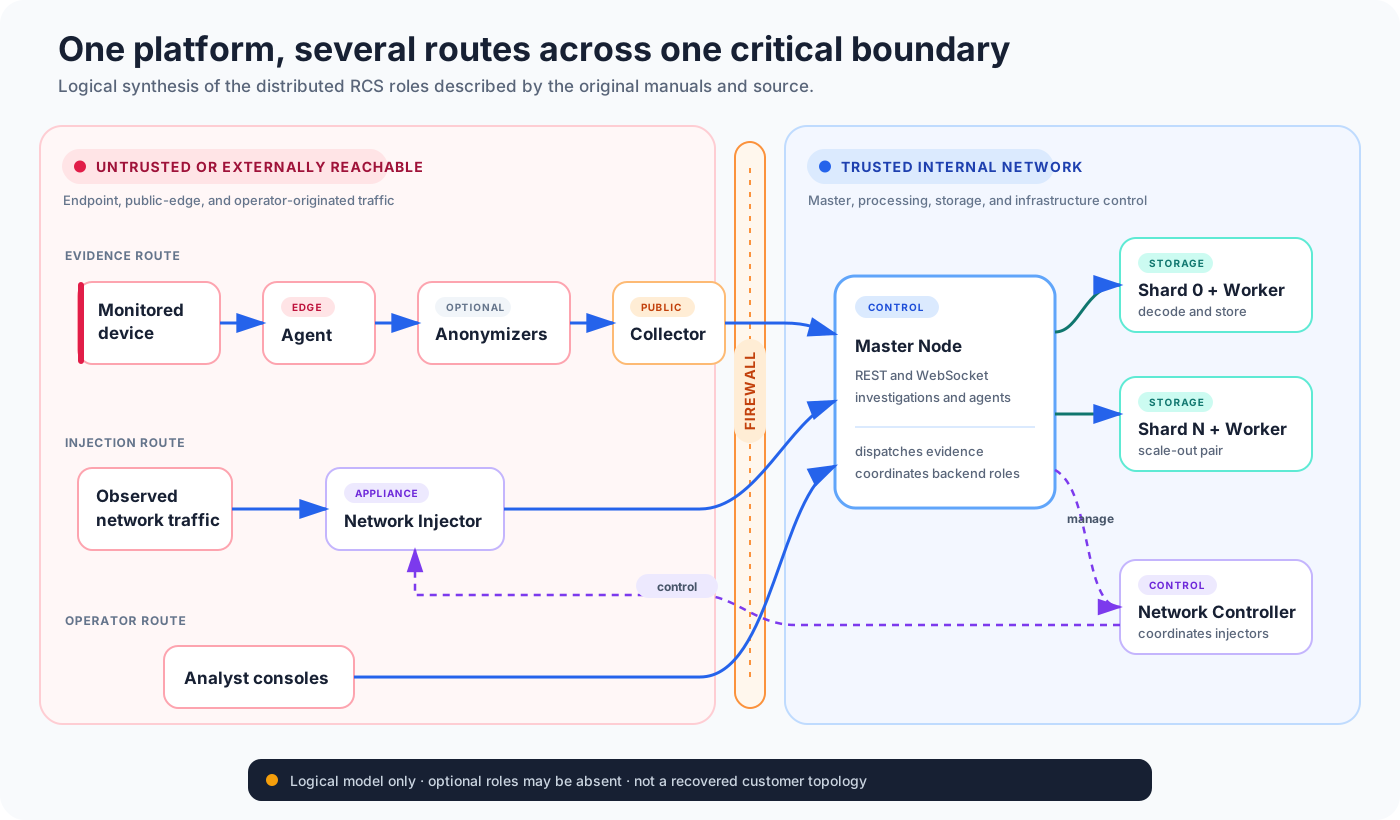
This schematic is logical, not a recovered customer topology. It combines the roles named in the two manual diagrams so that the boundaries are explicit. Real installations could omit optional components or use several collectors and anonymizer chains.
The two layouts change operational risk without changing the product model:
| Property | All-in-One backend | Distributed backend |
|---|---|---|
| Failure concentration | Master, first shard, and Worker share a smaller failure domain | Processing and storage can continue across several shard/Worker pairs |
| Credential concentration | More privileged functions converge on fewer hosts | Privileged material is spread across more hosts and links |
| Network observability | Fewer internal flows to monitor | More east-west component traffic and more places to collect logs |
| Acquisition strategy | One backend image may reveal much of the control plane | Investigators may need Master, shard, Worker, and configuration-server views |
| Compromise impact | One backend foothold can expose several functions at once | Segmentation can limit a foothold, but only if credentials and administrative paths are also separated |
The distinction matters for the later security assessment. Distribution is not itself isolation. If every backend role trusts the same operator credentials or an exposed database router, adding shards creates capacity rather than a new security boundary.
This chapter establishes the vocabulary used throughout the book. “Agent” can mean a deployed implant in ordinary security writing; in the backend it also means the database record representing that instance. Likewise, a “factory” is not a server: it is an agent configuration template waiting to be cloned when an instance first synchronizes.
The investigation hierarchy
The operator view begins with a hierarchy:
work group
└── operation
    └── target
        ├── factory
        └── deployed agent instance
An operation is an investigation. A target is the person or subject
inside it. A factory is the configured starting point for an agent. When a
new instance first reports its identity, the backend clones the matching open
factory into a deployed agent record named <factory> (N). Evidence and remote
requests then attach to that record and its target.
Visibility is group-driven. Users belong to work groups, and operations inherit the users associated with their groups. Targets and agents sit below those operations. This model determines what appears in the console and, as the security assessment will examine, creates unusual edge cases when group membership changes asynchronously or an object is created without a group.
The hierarchy is more than presentation. Paths recur in authorization checks, entity relationships, alerts, connectors, searches, and configuration forms. The product’s data model makes the investigation itself the organizing unit for surveillance.
In the backend, these objects share a polymorphic items collection. A _kind
field distinguishes group, operation, target, factory, and deployed-agent
records. Arrays such as path, group_ids, and user_ids denormalize ancestry
and visibility so that a query can decide access without walking the whole
tree. That improves routine reads, but it creates an important invariant: when
membership or ancestry changes, every affected copy must eventually agree.
Later chapters show why deferred access-control rebuilding deserves attention.
Creating a target also creates storage around it. The backend establishes the target’s evidence collection, aggregate collections, and GridFS namespaces. Destroying or moving a target is therefore not merely editing one document; it can affect a family of collections and the objects that name them.
The factory/agent distinction is equally consequential. A factory holds an open configuration template. At first synchronization, the server resolves an identity, clones the factory, and turns the clone into the persistent record for a particular instance. The lab exercises that backend state transition with synthetic identifiers. It does not create, deliver, or run the executable that would ordinarily initiate it.
A work group is also a security object, not just a folder. Its members determine which users are copied into operations and their descendants. The Console makes this look like familiar collaboration, while the server must preserve a graph of duplicated authorization facts. That combination—easy administrative UI over denormalized authorization—is a recurring theme in the assessment.
The endpoint collection plane
The hierarchy explains where a deployed agent belongs. It does not explain what endpoint code could collect. For that, the relevant evidence is not a console label or a shared log constant but a chain through the source: a module is registered or dispatched, a concrete implementation exists, and the result reaches an evidence writer, log constructor, or companion IPC path.
Two naming systems meet here. In the product, Scout, Soldier, and
Elite are agent levels. Scout was the small first stage used to inspect an
installation environment before an operator chose whether to replace it.
Soldier was an intermediate Windows stage, while Elite named the fuller agent
level. In the leaked archive, however, the labels do not map to three parallel
cross-platform source families. The inspected Scout and Soldier implementations
live in the dedicated scout-win and soldier-win trees. The core-* label is
this book’s shorthand for the platform-specific full-core repositories such as
core-android, core-ios, and core-win32.
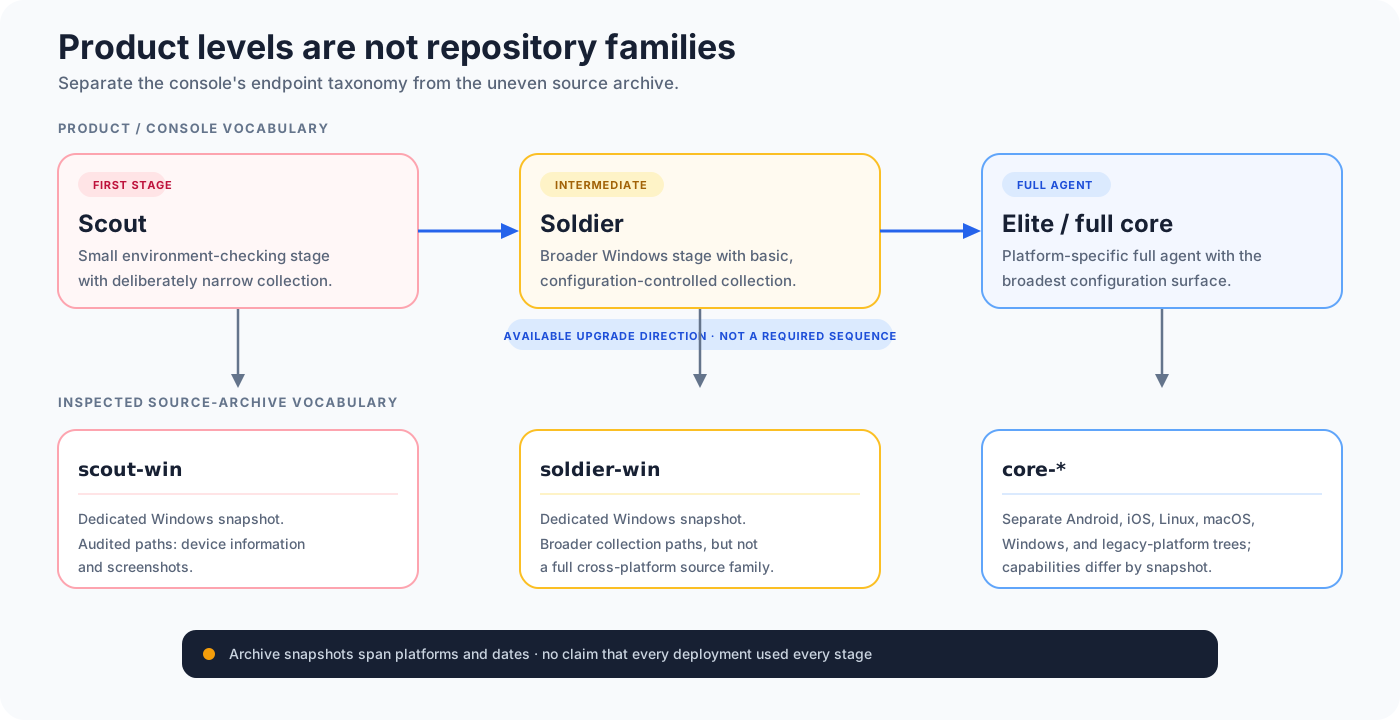
The diagram is deliberately asymmetric. The archive does not support treating
Scout, Soldier, and every core-* tree as equivalent builds from one release,
or assuming that each platform passed through all three levels.
With that distinction in place, a static audit across the frozen core-*,
Scout, and Soldier trees finds broad
but uneven coverage. Across the platform set, concrete paths cover
communications, contacts and calendars, call records, device and application
state, location, screenshots and camera images, microphone capture,
credentials, clipboard and key input, web activity, and selected files or
service data. This is a union of platform-specific source findings, not a list
that every implant implemented. Android and Linux expose relatively clear
module factories or registration tables. iOS explicitly divides concrete
internal agents from generic remote-agent instances. macOS and Windows desktop
mix local collection with injected or IPC-backed companions. Symbian and
BlackBerry have smaller registered sets. Windows Mobile and Windows Phone
differ even though they share names and ancestry.
The staged Windows sources make the danger of flattening especially obvious. Scout directly packages device information and screenshots, while its social source is empty and its webcam source is commented out. Soldier starts a wider configuration-controlled set, including social/account data, location, clipboard, credential, screenshot, camera, URL, device, and file-related paths, but its standalone photo thread is disabled. The 64-bit Windows tree is a partial companion for a larger desktop core, not a second feature-complete implant. Android’s native and audio trees are treated as supporting projects rather than independent products.
The audit therefore uses six states: Implemented, Conditional, Stub/disabled, Referenced only, Absent from the inspected registry, and Unresolved. Even “Implemented” is only a SOURCE conclusion. It does not show that a historical build included the module, that a customer was entitled to it, that a device met its prerequisites, or that collection succeeded. Application-specific chat and service collectors add further dependencies on installed versions, local schemas, privileges, and runtime state.
Representative anchors include Android’s factory at
core-android/RCSAndroid/src/com/android/dvci/module/FactoryModule.java:25-45,
Linux’s registration table at core-linux/core/src/module.c:15-31, iOS’s
internal/remote split at
core-ios/core/Modules/Agents/RCSIAgentManager.mm:368-450, Symbian’s compact
factory at core-symbian/Core/src/AgentFactory.cpp:23-46, and the Windows
desktop registrar sequence at core-win32/AM_Core.cpp:413-433. The complete
frozen-revision matrix and registration-to-writer evidence appear in
Appendices D–E.
This endpoint plane joins the rest of the architecture at an evidence-format boundary. Endpoint modules emit typed records; collectors and routing components move them; the Worker decodes them; target-scoped storage and the console make them searchable. The active reconstruction starts after the endpoint and collector. Chapter 7 preserves that gap when it distinguishes a source-derived record shape from a synthetic Worker replay and from a direct database fixture.
The operator plane
The original console is an Adobe AIR 15 application written in MXML and ActionScript. It authenticates to the database service over HTTPS and maintains a WebSocket connection for push events. Its major sections expose the product’s roles:
| Section | Operator purpose |
|---|---|
| Home | Search, recents, and investigation shortcuts |
| Monitor | Component health, version, licensing, and counters |
| Operations | Targets, agents, configuration, evidence, and requests |
| Intelligence | Entities, identities, links, and geographic views |
| Dashboard | Pinned operations and evidence activity |
| Alerting | Per-user rules and matching evidence notifications |
| Accounting/Audit | Users, groups, permissions, sessions, and activity |
| System | Collectors, anonymizers, shards, backups, injectors, and connectors |
This is why the console matters to capability assessment. A list of implant modules says what data might be collected. The console shows how collection becomes routine work: filters, saved views, maps, graphs, request queues, notifications, and collaboration.
The account model divides operators into four broad roles: administrator, system administrator, technician, and viewer. More granular privileges qualify those roles for actions such as evidence deletion, configuration, and system management. Role names alone are therefore insufficient when reconstructing an incident. An examiner needs the account record, its subprivileges, its group membership, and the audit history surrounding the action.
The operator protocol is also split. Ordinary commands and responses travel through the HTTPS REST service, while changes, status messages, alerts, and session events arrive over WebSocket push. A console can consequently show a state that was initially fetched and then incrementally patched. Forensic reconstruction must ask whether a fact came from a stored REST response, a later push event, or client-side state that was never persisted.
The backend plane
At the center is rcs-db, a Ruby EventMachine application. In the examined
snapshot it serves the operator REST API over HTTPS and push over a WebSocket
port one number higher. It manages accounts, investigations, agent records,
evidence metadata, configuration, topology, tasks, licensing, audit records,
and backups.
MongoDB holds that state. RCS expects a sharded deployment even in the small lab recreation: a mongos router, a shard server, and a configuration server. Evidence is separated into collections named for each target, with large binary objects stored in corresponding GridFS collections. That layout is both an implementation decision and a forensic fingerprint.
Storage falls into several useful forensic classes:
- Global application collections hold users, sessions, items, topology, alerts, audit material, and other control-plane records.
- Per-target collection families hold typed evidence and derived aggregate data, keeping the investigation hierarchy visible in physical storage.
- GridFS collections hold larger binaries referenced by evidence records, so a metadata acquisition without its chunks can be incomplete.
- Worker and queue state records material that is waiting to be decoded, indexed, matched, or dispatched.
- MongoDB configuration data describes the sharded topology and can explain where a target’s records physically resided.
The per-target layout is convenient for lifecycle operations, but it raises the
cost of complete acquisition. A collection list, shard map, and GridFS
inventory can be as important as an export from the main items collection.
It also means that a count from a global model and a count from a target
evidence collection answer different questions.
The worker handles the evidence-processing path. Source defines the route from an encrypted evidence blob through decryption, storage, alert-queue insertion, matching, and push notification. Project notes record an earlier synthetic lab exercise of that route, but the current publication artifacts do not include a named automated test and sanitized trace. Even after that gate is repeated, it will prove only the backend portion of the pipeline, not an implant-to-collector session.
In the documented distributed design, each shard has a Worker. Backend source selects a Worker from the configured set using a stable calculation over the incoming identity. That ties processing distribution to storage layout and helps keep a given stream’s work predictable. It also makes Worker inventory and health relevant to apparent collection gaps: absent evidence can mean no collection, delayed forwarding, failed processing, or storage on a shard that was not acquired.
The server also owns tasks that would normally produce downloads, topology updates, database maintenance, backups, or builds. The web console permits benign administrative task paths needed for fidelity, but all implant and installer build controls are render-only and are tested never to create a build task.
Not every job is represented in the same way. Some tasks are short-lived, per-user, in-memory work coordinated by the running server. Backup definitions, archives, alert queues, and other operational objects are persistent. This distinction affects both recovery and evidence: restarting a service may erase one class of pending state while leaving another class intact. A screenshot of the task manager is therefore not a durable job ledger.
The collection and routing plane
The collector faces agent traffic. Source and manuals describe it as the point that receives synchronization traffic and forwards material toward the backend while presenting decoy behavior to invalid requests. Collectors can be placed behind chains of anonymizers, remote systems intended to separate a publicly visible endpoint from the backend and collector topology.
The manual describes continuity at both ends of this path. An agent can retain a bounded amount of material while it cannot reach its server, and a collector can store received data locally while the Master Node is unavailable, then forward it after connectivity returns. This is a MANUAL claim about intended operation. The reconstruction has not measured those edge buffers, their limits, or their failure behavior because doing so would require running excluded implant or edge components.
Collector records in the backend include topology relationships and a notion of whether an entry belongs to the public or protected side. Anonymizer chains are ordered routes rather than an undifferentiated pool: topology affects which collector receives traffic and what infrastructure an external observer may see. A seized frontend host may therefore reveal only the next hop, while the Master’s topology records can reveal the intended chain.
The product also supported Network Injectors positioned where they could identify selected HTTP traffic and alter or replace content. The manuals describe provider-installed and tactical forms. These components are central to understanding RCS as a delivery platform, but they are not active in this lab. Their behavior in later chapters is therefore SOURCE or MANUAL evidence, not a description of packets generated during reconstruction.
A Network Controller coordinates the injector side of the design. In the distributed diagram it is a shared control component even when storage and processing are spread across many shard/Worker pairs. This is a useful reminder that a platform can distribute data capacity while retaining a concentrated control point. Static analysis maps the modeled objects, rules, and file-transfer workflows. How a particular customer placed or used an injector remains unknown.
The analysis plane
Stored evidence is typed. The manuals enumerate address books, applications, calendars, calls, camera images, chats, clipboard contents, device data, files, filesystem listings, informational records, keylogs, messages, microphone recordings, mouse activity, passwords, positions, print activity, screenshots, and URLs. The backend and console add operational metadata around those types: date filters, relevance, notes, binary viewers, statistics, deletion, and export.
The Intelligence subsystem builds entities and handles above raw evidence. An analyst can represent people and virtual identities, associate accounts, create relationships, and view locations. Alerting connects new evidence to per-user rules scoped to an operation path. Connectors provide export pipelines to other systems. Together these features show the shift from collection to analysis: RCS was designed to keep an investigation alive, not merely exfiltrate a file.
That analytical layer mixes several kinds of provenance. A message or image can be collected material; a parsed handle or geographic point can be derived from it; an entity name, relationship, relevance flag, or note can be an analyst’s assertion. Exports and screenshots often flatten those distinctions. A careful report should preserve the raw evidence identifier, processing metadata, and analyst-created object separately instead of treating every field visible in the Console as a direct observation from a device.
Backups, connectors, and audit records extend this provenance problem beyond the live database. A backup may preserve records later deleted from the active view. A connector can create another copy under different retention controls. An audit record may show an operator action without proving the truth of the underlying evidence. These are distinct sources that should be correlated, not silently merged.
From collection to an analyst’s screen
The complete logical data flow is longer than the familiar agent-to-server arrow. A useful reconstruction separates collection, transport, processing, storage, notification, and presentation:
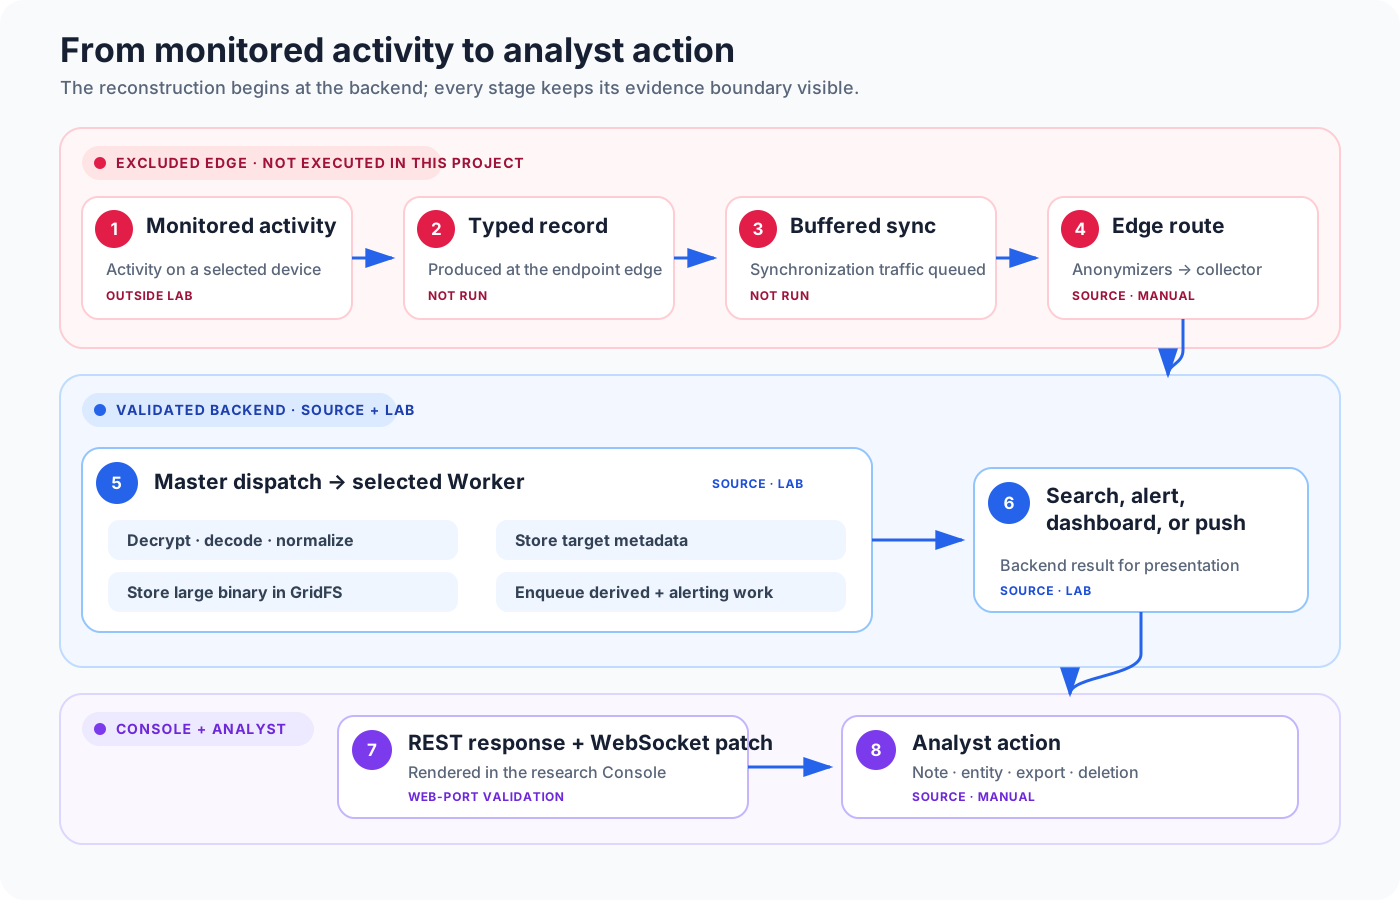
The labels on the right are part of the methodology. They prevent a successful backend experiment from being reported as validation of the excluded edge. The lab enters this flow at two safe points. It can create a synthetic factory and send the authentic first-status transition that produces a database agent record. Separately, it can submit a synthetic encrypted evidence object to the Worker and observe backend processing. Some UI fixtures are inserted directly into lab MongoDB when the leaked REST endpoint is absent or broken. None of these actions constructs an installer, operates a deployed implant, activates an anonymizer, or intercepts third-party traffic.
The same diagram can be read backwards during an investigation. Start with the screen or export, recover its evidence identifier and target collection, locate the GridFS object if present, correlate Worker and alert-queue state, identify the agent database record and its path, and finally use collector/topology logs to reason about transport. Each backward step can fail independently. That is why “the Console showed it” is a weaker statement than a chain linking raw bytes, database metadata, processing records, and operator activity.
An architecture-led acquisition map
The component model suggests a minimum acquisition plan for a suspected RCS backend. This is not a substitute for normal host and network forensics; it is a map of where product-specific state can diverge.
| Source | What it can establish | What it cannot establish alone |
|---|---|---|
| Master application files and logs | Configuration, listener behavior, application errors, REST actions, component status | Complete evidence contents or every transient task |
| Main MongoDB application database | Accounts, investigations, paths, topology, alerts, audits, persistent jobs | Large evidence binaries and state already removed or never persisted |
| Target evidence collections | Typed evidence metadata and target-scoped records | The referenced GridFS bytes, operator intent, or original transport path |
| GridFS files and chunks | Binary payloads corresponding to evidence metadata | Meaning without the referencing document and decoder context |
| MongoDB config server and shard metadata | Which shards existed and how collections were distributed | Whether every shard was successfully acquired |
| Worker logs and queues | Receipt, processing, errors, and downstream enqueue activity | What occurred on the monitored device before receipt |
| Collector host and backlog | Edge receipt, local delay, next-hop configuration, and possible queued material | Analyst access or final backend processing |
| Console workstation | Cached exports, screenshots, credentials, user-visible state, and analyst artifacts | Authoritative server state at any arbitrary earlier time |
| Backup archives and connector destinations | Historical or replicated copies outside the live database | Why a copy was created or whether it was later modified elsewhere |
Order matters. Before querying through the application, preserve volatile process, socket, and queue state and identify every database member. Before interpreting target evidence counts, confirm that the relevant shard and its GridFS chunks are present. Before accepting a Console export as raw evidence, trace its identifiers back to stored records and determine which fields were derived or analyst-authored. These are general forensic cautions made concrete by RCS’s architecture.
The topology also helps explain negative findings. An empty active target collection is not evidence that no record ever existed: one may remain in a collector backlog, wait in a Worker stage, reside on a missing shard, survive only in a backup, or have been deleted. Conversely, an orphaned GridFS object only shows that bytes remain. Interrupted processing or deleted metadata may have kept them from an analyst. Claims should name the layer actually examined.
For network acquisition, the same principle applies. The Master exposes an operator-facing HTTPS service and a related WebSocket service; Workers, collectors, database roles, and optional edge components add separate flows. A packet capture at the operator boundary answers different questions from one at the collector or database boundary. The IOC appendix therefore records ports, headers, certificates, and protocol traits by component rather than publishing one undifferentiated “RCS traffic” signature.
Trust boundaries
For reconstruction, the architecture has four useful trust boundaries:
- Public edge: implants, collectors, anonymizers, and injectors.
- Component network: collectors, workers, the master service, and MongoDB.
- Operator boundary: REST, WebSocket push, sessions, users, groups, and administrative permissions.
- Evidence boundary: target collections, GridFS, exports, backups, and audit records.
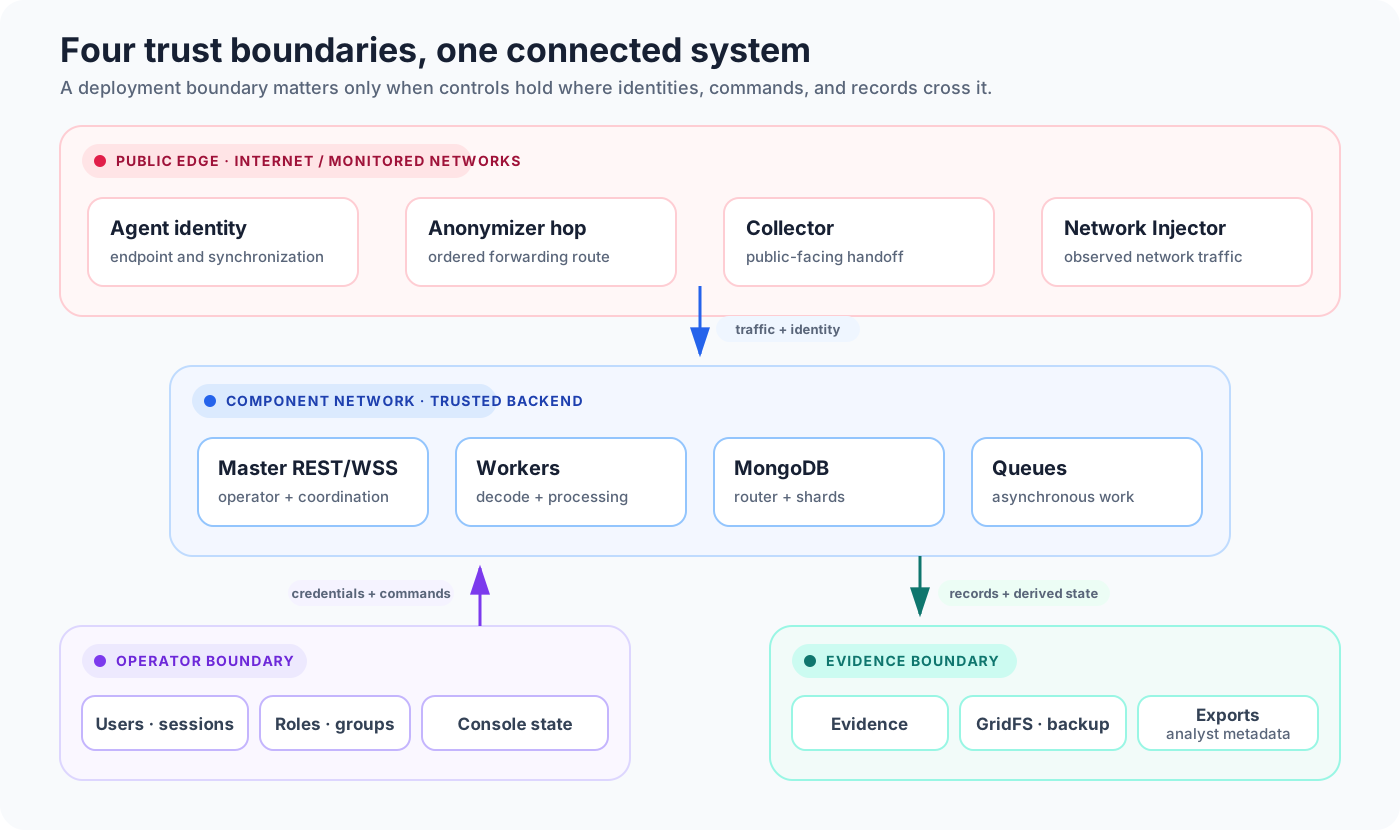
Each boundary carries different assets and different questions:
| Boundary | Assets crossing it | Claimed or observed controls | Assessment question |
|---|---|---|---|
| Public edge | Identities, synchronization traffic, evidence batches, routing metadata | Anonymizer chains, collector authentication/certificates, decoy responses, firewall placement | Can an outsider identify, impersonate, bypass, or trace an edge component? |
| Component network | Decoded evidence, topology commands, Worker jobs, database queries | Protected network placement, component configuration, shard routing | Does one component foothold become trusted access to the backend or database? |
| Operator | Credentials, session cookies, REST commands, push messages | TLS, roles, subprivileges, groups, audit events | Are authorization decisions consistent across endpoints and object states? |
| Evidence | Raw bytes, metadata, derived objects, exports, archives | Target separation, GridFS references, application checks, audit and backup workflows | Can evidence be read, altered, deleted, or confused without a reliable record? |
The original deployment assumed that several of these boundaries would be protected operationally. The security chapter will test what the code itself enforces when those assumptions fail. That distinction matters: an unauthenticated MongoDB port reachable only after a firewall mistake is not the same problem as an authorization bypass in the public REST service, but either can expose the same victims.
Trust boundaries also move with deployment choices. Putting a collector in a screened network is meaningful only if its management path, stored backlog, and credentials are protected independently. Distributing shards reduces a single storage bottleneck, but a broadly trusted database router can reunify them for an intruder. TLS protects a channel, but it does not correct an endpoint that authorizes the wrong user. The assessment therefore evaluates controls at the point of use rather than treating the manual’s firewall line as proof.
Availability was part of the surveillance design
Several architectural choices aim to keep an investigation producing data through intermittent failure: bounded buffering at the agent, local retention at the collector, multiple Worker/shard pairs, queues between processing stages, health monitoring, and scheduled backups. Availability is not ancillary here. Delayed evidence still has investigative value, so the platform is built to resume a data path rather than require every component to be continuously reachable.
That resilience creates ambiguity for incident responders. A missing interval may be sitting on an edge buffer; duplicated-looking records may result from a retry; an alert may lag behind storage; a backup may contain a different state from the active database. Timestamp semantics therefore matter. Device time, receipt time, processing time, and analyst modification time should not be collapsed into a single chronology.
The same mechanisms expand the protection problem. Buffers and backups are additional evidence stores. Queues can expose sensitive metadata before the final record is visible. Health and topology screens reveal internal structure. High availability without compartmentalized credentials and retention creates more durable copies for both defenders and intruders.
What this architecture establishes
Before examining version skew or individual vulnerabilities, the recovered design establishes several facts:
- RCS was an enterprise, multi-user investigation platform, not only an implant.
- The backend modeled investigations, authorization, evidence, topology, processing, analysis, maintenance, and export as connected workflows.
- An all-in-one backend still depended on distinct edge and operator roles; distributed storage did not automatically create security isolation.
- Evidence passed through multiple durable and transient representations, each with different provenance and acquisition value.
- The lab validates selected backend and Console behaviors while deliberately leaving collection, delivery, exploitation, and public-edge operation inert.
These statements are architectural, not claims that every customer enabled every feature or deployed the recommended topology. The archive describes a product’s possibilities; source code reveals implemented behavior; lab results show what the bounded reconstruction actually did. Keeping those categories separate is the foundation for the chapters that follow.
The next chapter complicates this clean diagram. The components in the archive come from different release lines, and the exact boundaries depend on which snapshot is speaking to which.
Sources and evidence
- MANUAL: RCS 9 System Administrator’s Guide, PDF pages 23–27 (printed pages 7–11), All-in-One and distributed architecture, component catalogue, buffering, shard/Worker placement, and front-end/back-end boundary.
- MANUAL: RCS 9 Analyst’s Guide, investigation hierarchy and evidence types.
- MANUAL: RCS 9 Technician’s Guide, printed page 39, Scout installation, environment review, and replacement by the fuller agent.
- SOURCE:
rcs-db/lib/rcs-db/db_objects/item.rb,user.rb, andgroup.rbfor the hierarchy, target storage, roles, and denormalized visibility. - SOURCE:
rcs-db/lib/rcs-db/evidence_dispatcher.rbandevents.rbfor Worker selection and the HTTPS/WebSocket service split. - SOURCE:
rcs-common,rcs-collector,rcs-anonymizer,rcs-console, andrcs-console-librarysource trees at the commits listed in Appendix I. - SOURCE:
rcs-console/.../AgentUpgrade.mxmlandconfiguration/basic/BasicView.mxmlfor the Scout/Soldier/Elite labels, available upgrade states, and level-dependent configuration controls. - SOURCE: platform factories, registration tables, concrete modules, and
evidence/log/IPC sinks in the frozen
core-*,scout-win, andsoldier-winrevisions listed in Appendices D–E and I; the detailed control record isresearch/hackingteam-rcs/IMPLANT-CAPABILITY-AUDIT.md. - LAB:
docker-lab/README.mdanddocker-lab/IOCs.md. - WEB PORT:
docker-lab/console-web/MILESTONES.mdand the mock/live/manual validation suites.
↑ HackingTeam's RCS: Bringing a Commercial Spyware Platform Back to Life